Tutorial
Normalized Database for Querying I90 Files from REE
Build a normalized database to efficiently query and analyze historical energy programming data from the Spanish electrical system. Learn database design, normalization, and optimization for energy market analysis.
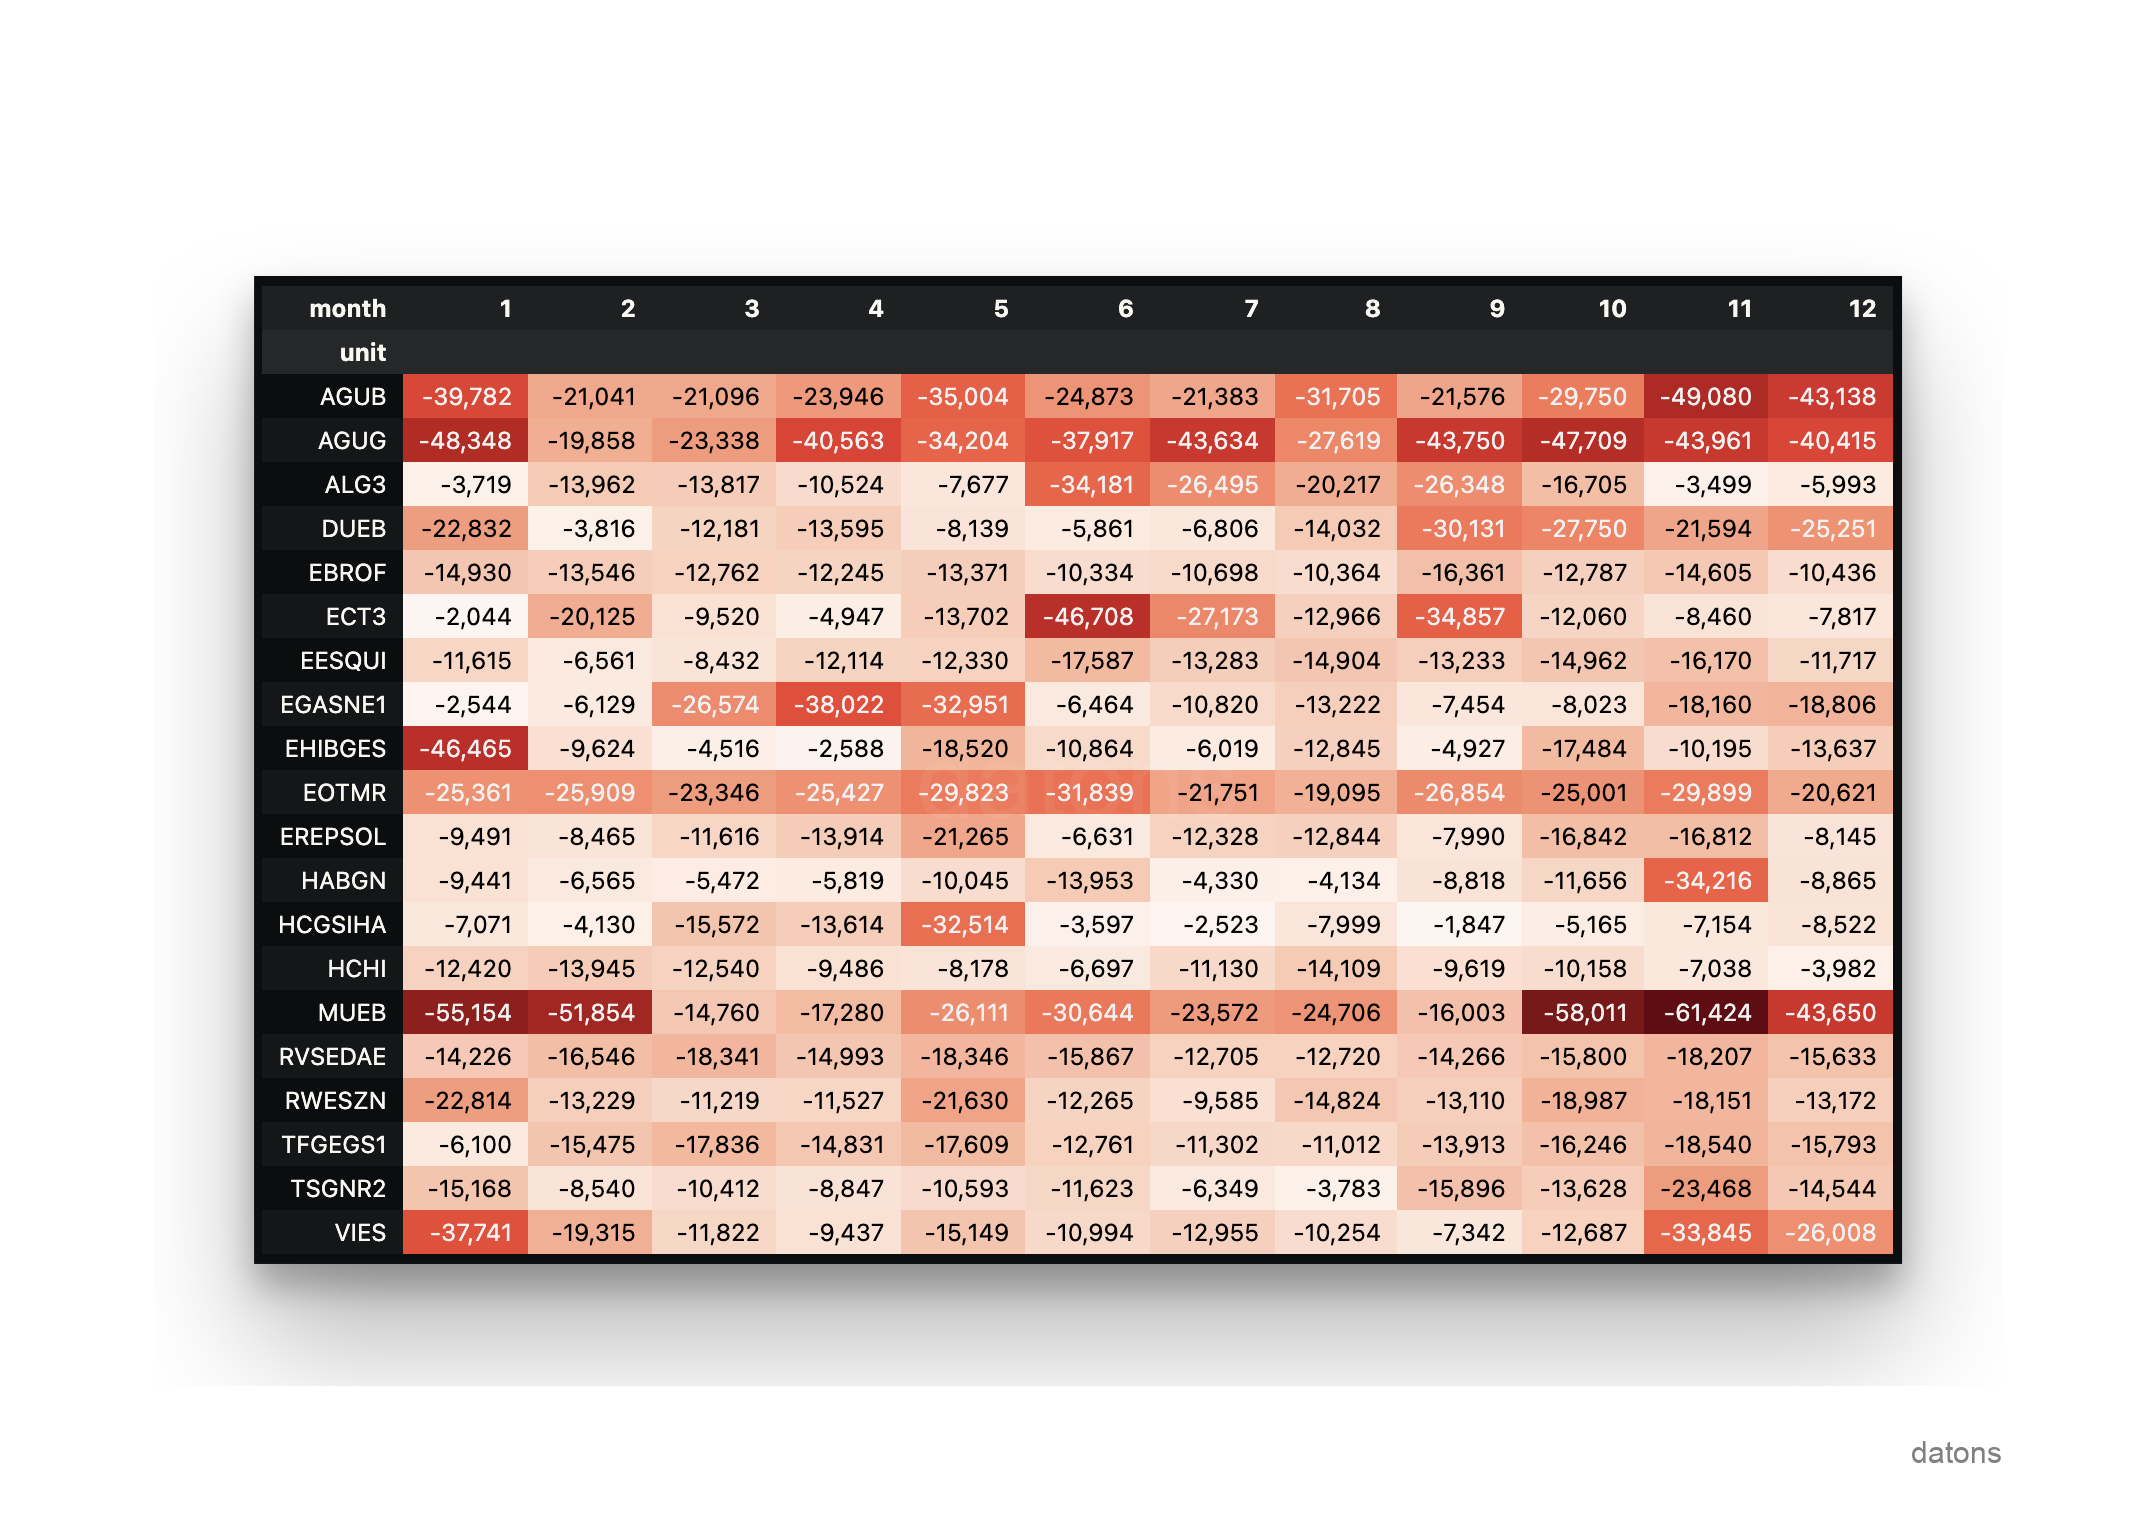
Imagine you are an energy trader and want to analyze the energy management of the most important units in the Spanish electricity market, those that have suffered the most curtailment. Ideally, you would have the historical information of the energy programming units in a database (DB) to be able to query and analyze it efficiently.
For example, you would like to query which have been the 5 units that have suffered the most curtailment after the day-ahead market in each month of the year 2023. First, you download the operational information from a database and then analyze it.
from sqlalchemy import create_engine
import pandas as pd

engine = create_engine(f'postgresql://{USER}:{PASSWORD}@{URL}:{PORT}/{DATABASENAME}')
df = pd.read_sql_table(query, engine)

idx = df.groupby('unit').energy.sum().nsmallest(20).index
(df
 .query('unit in @idx')
 .pivot_table(
   index='unit',
   columns='month',
   values='energy',
   aggfunc='sum'
   )
)
Why do you need a database to analyze the information from the I90 files? We explain it below.
I90 files context
Introduction
As explained in this tutorial, the I90 files from REE provide daily information on energy programming units in Spain according to generation programs.
Limitations of public servers
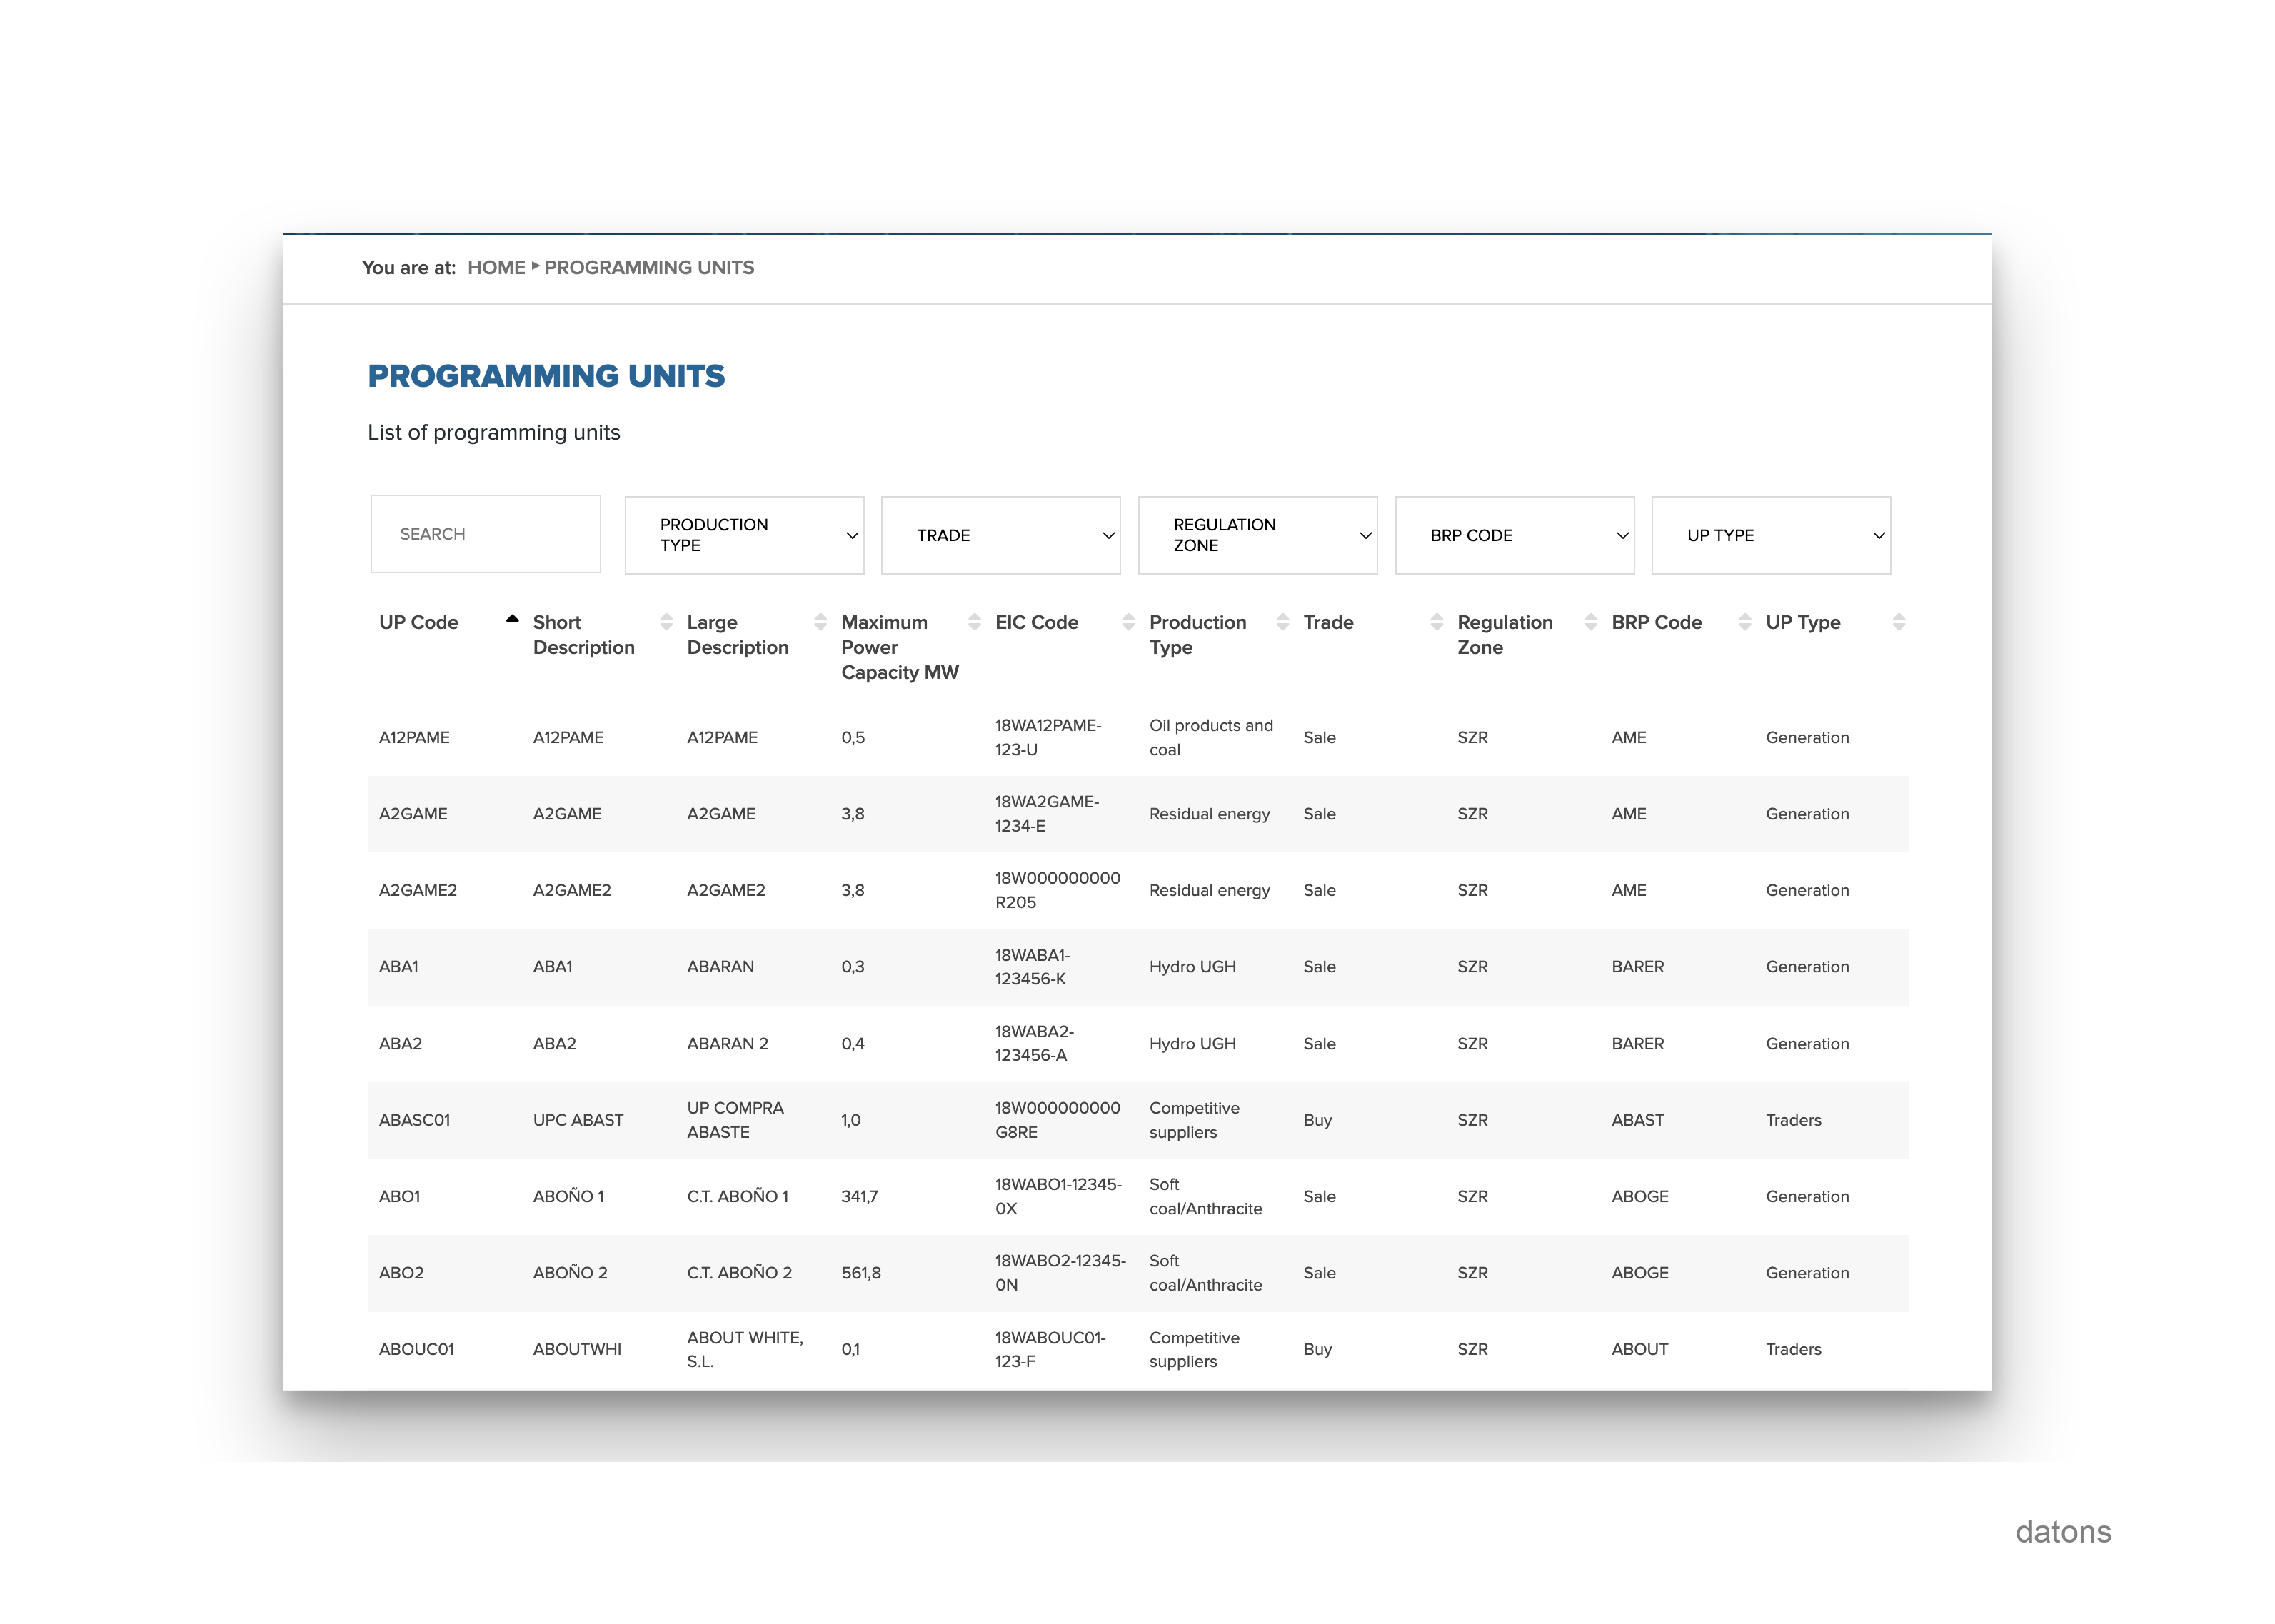
To work with all the historical information, we will download all the I90 files from REE through their website, from the first available date to the current date. Once the search is resolved, we click on the I90 file to download the zip.
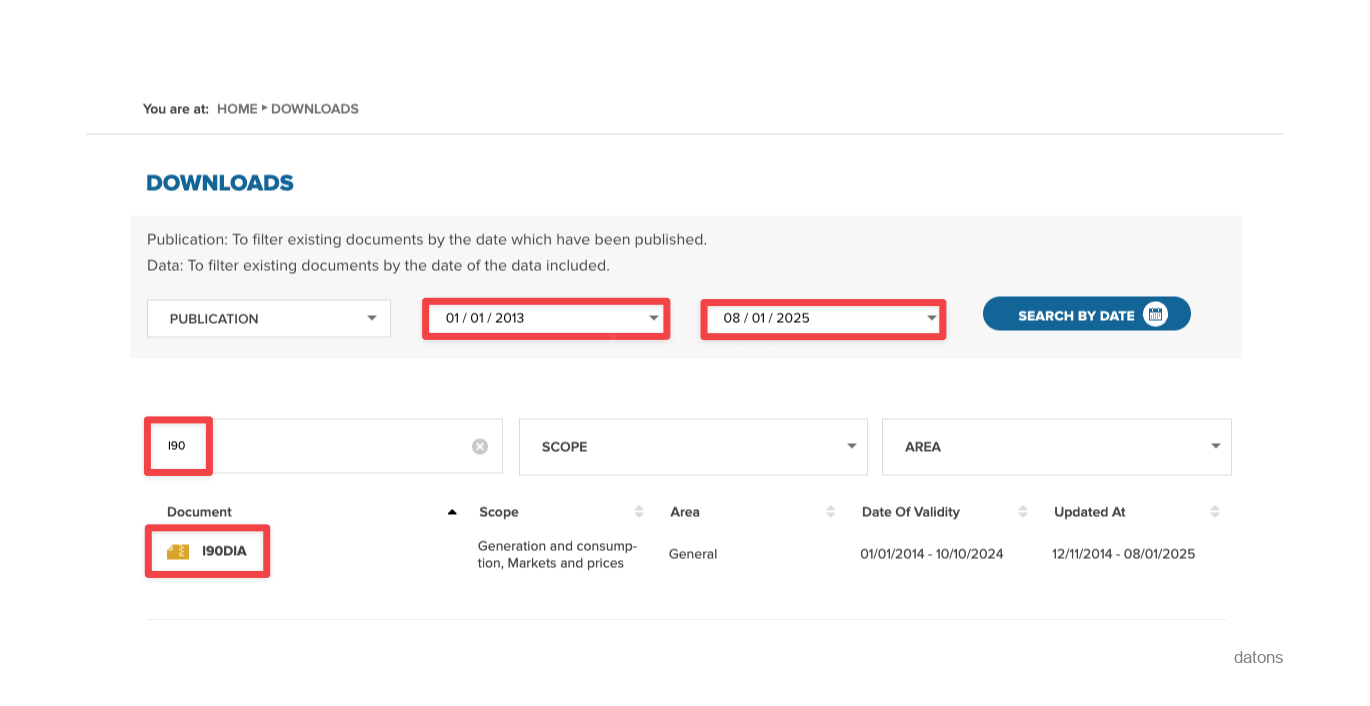
The first failure we encounter when requesting such a wide range of data is that the servers cannot support the amount of data to be sent and crash, showing an error.
{
   "Status": 500,
   "message": "Internal server error"
}
For each day, REE should return a zip with as many Excels as there are days in the requested period.
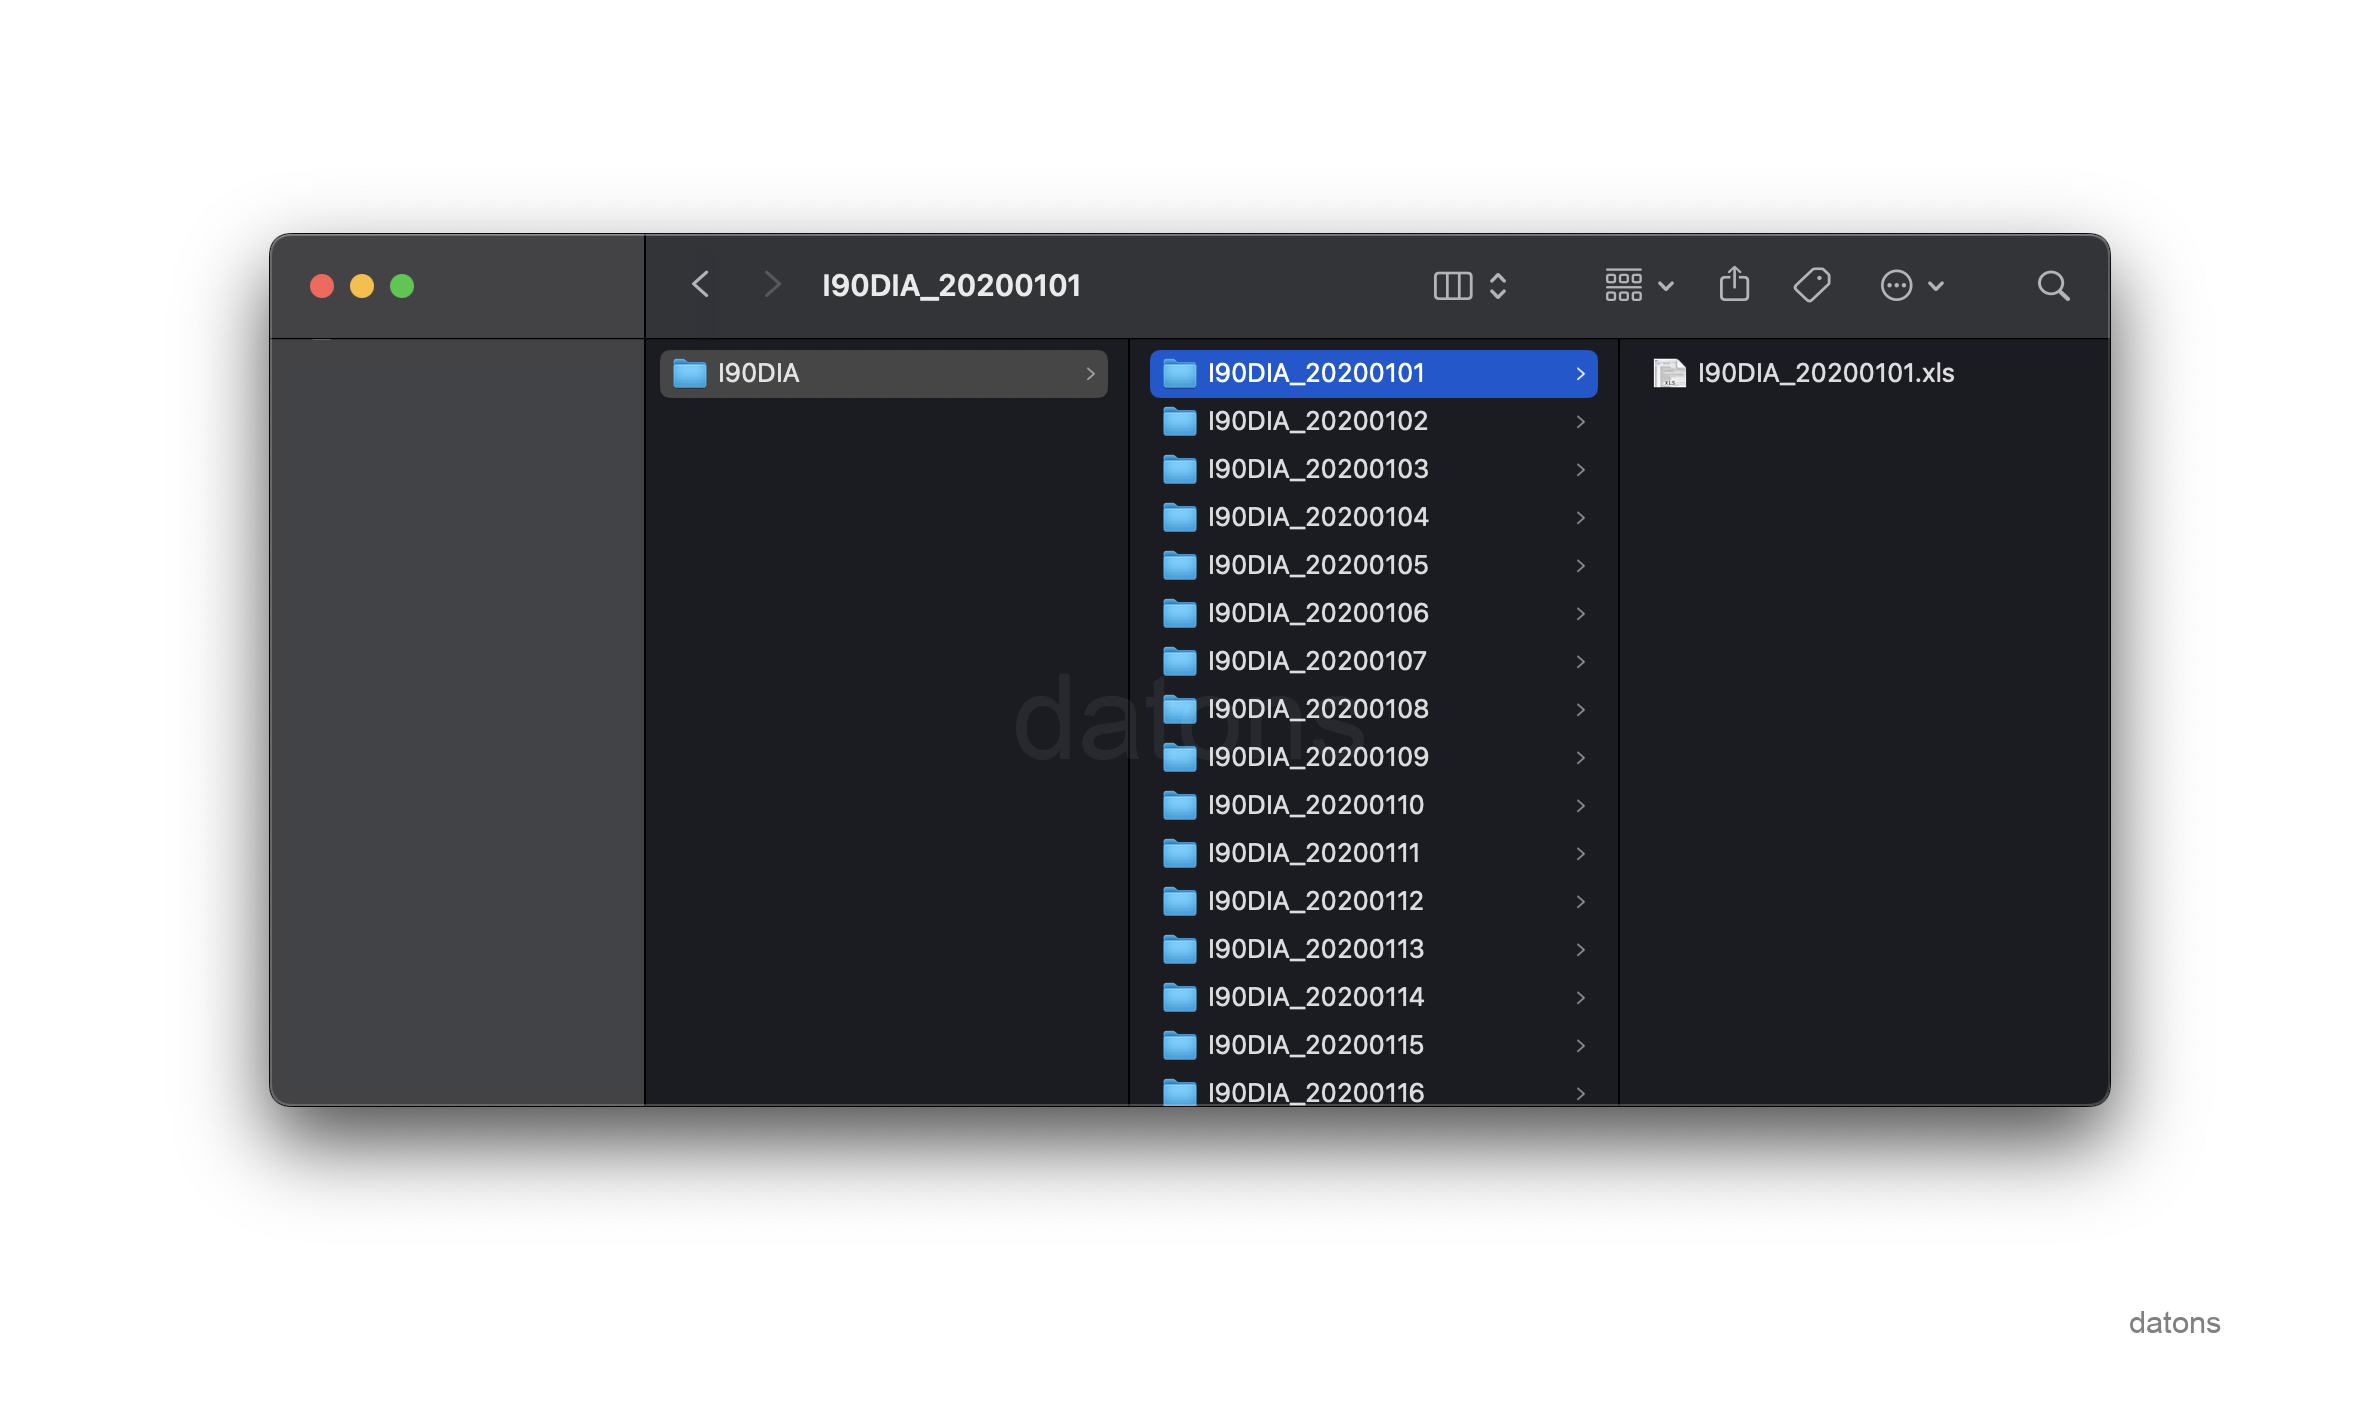
If we also have to filter the information by market subjects among all the Excels, we would not only have to download the data but also filter it over each Excel.
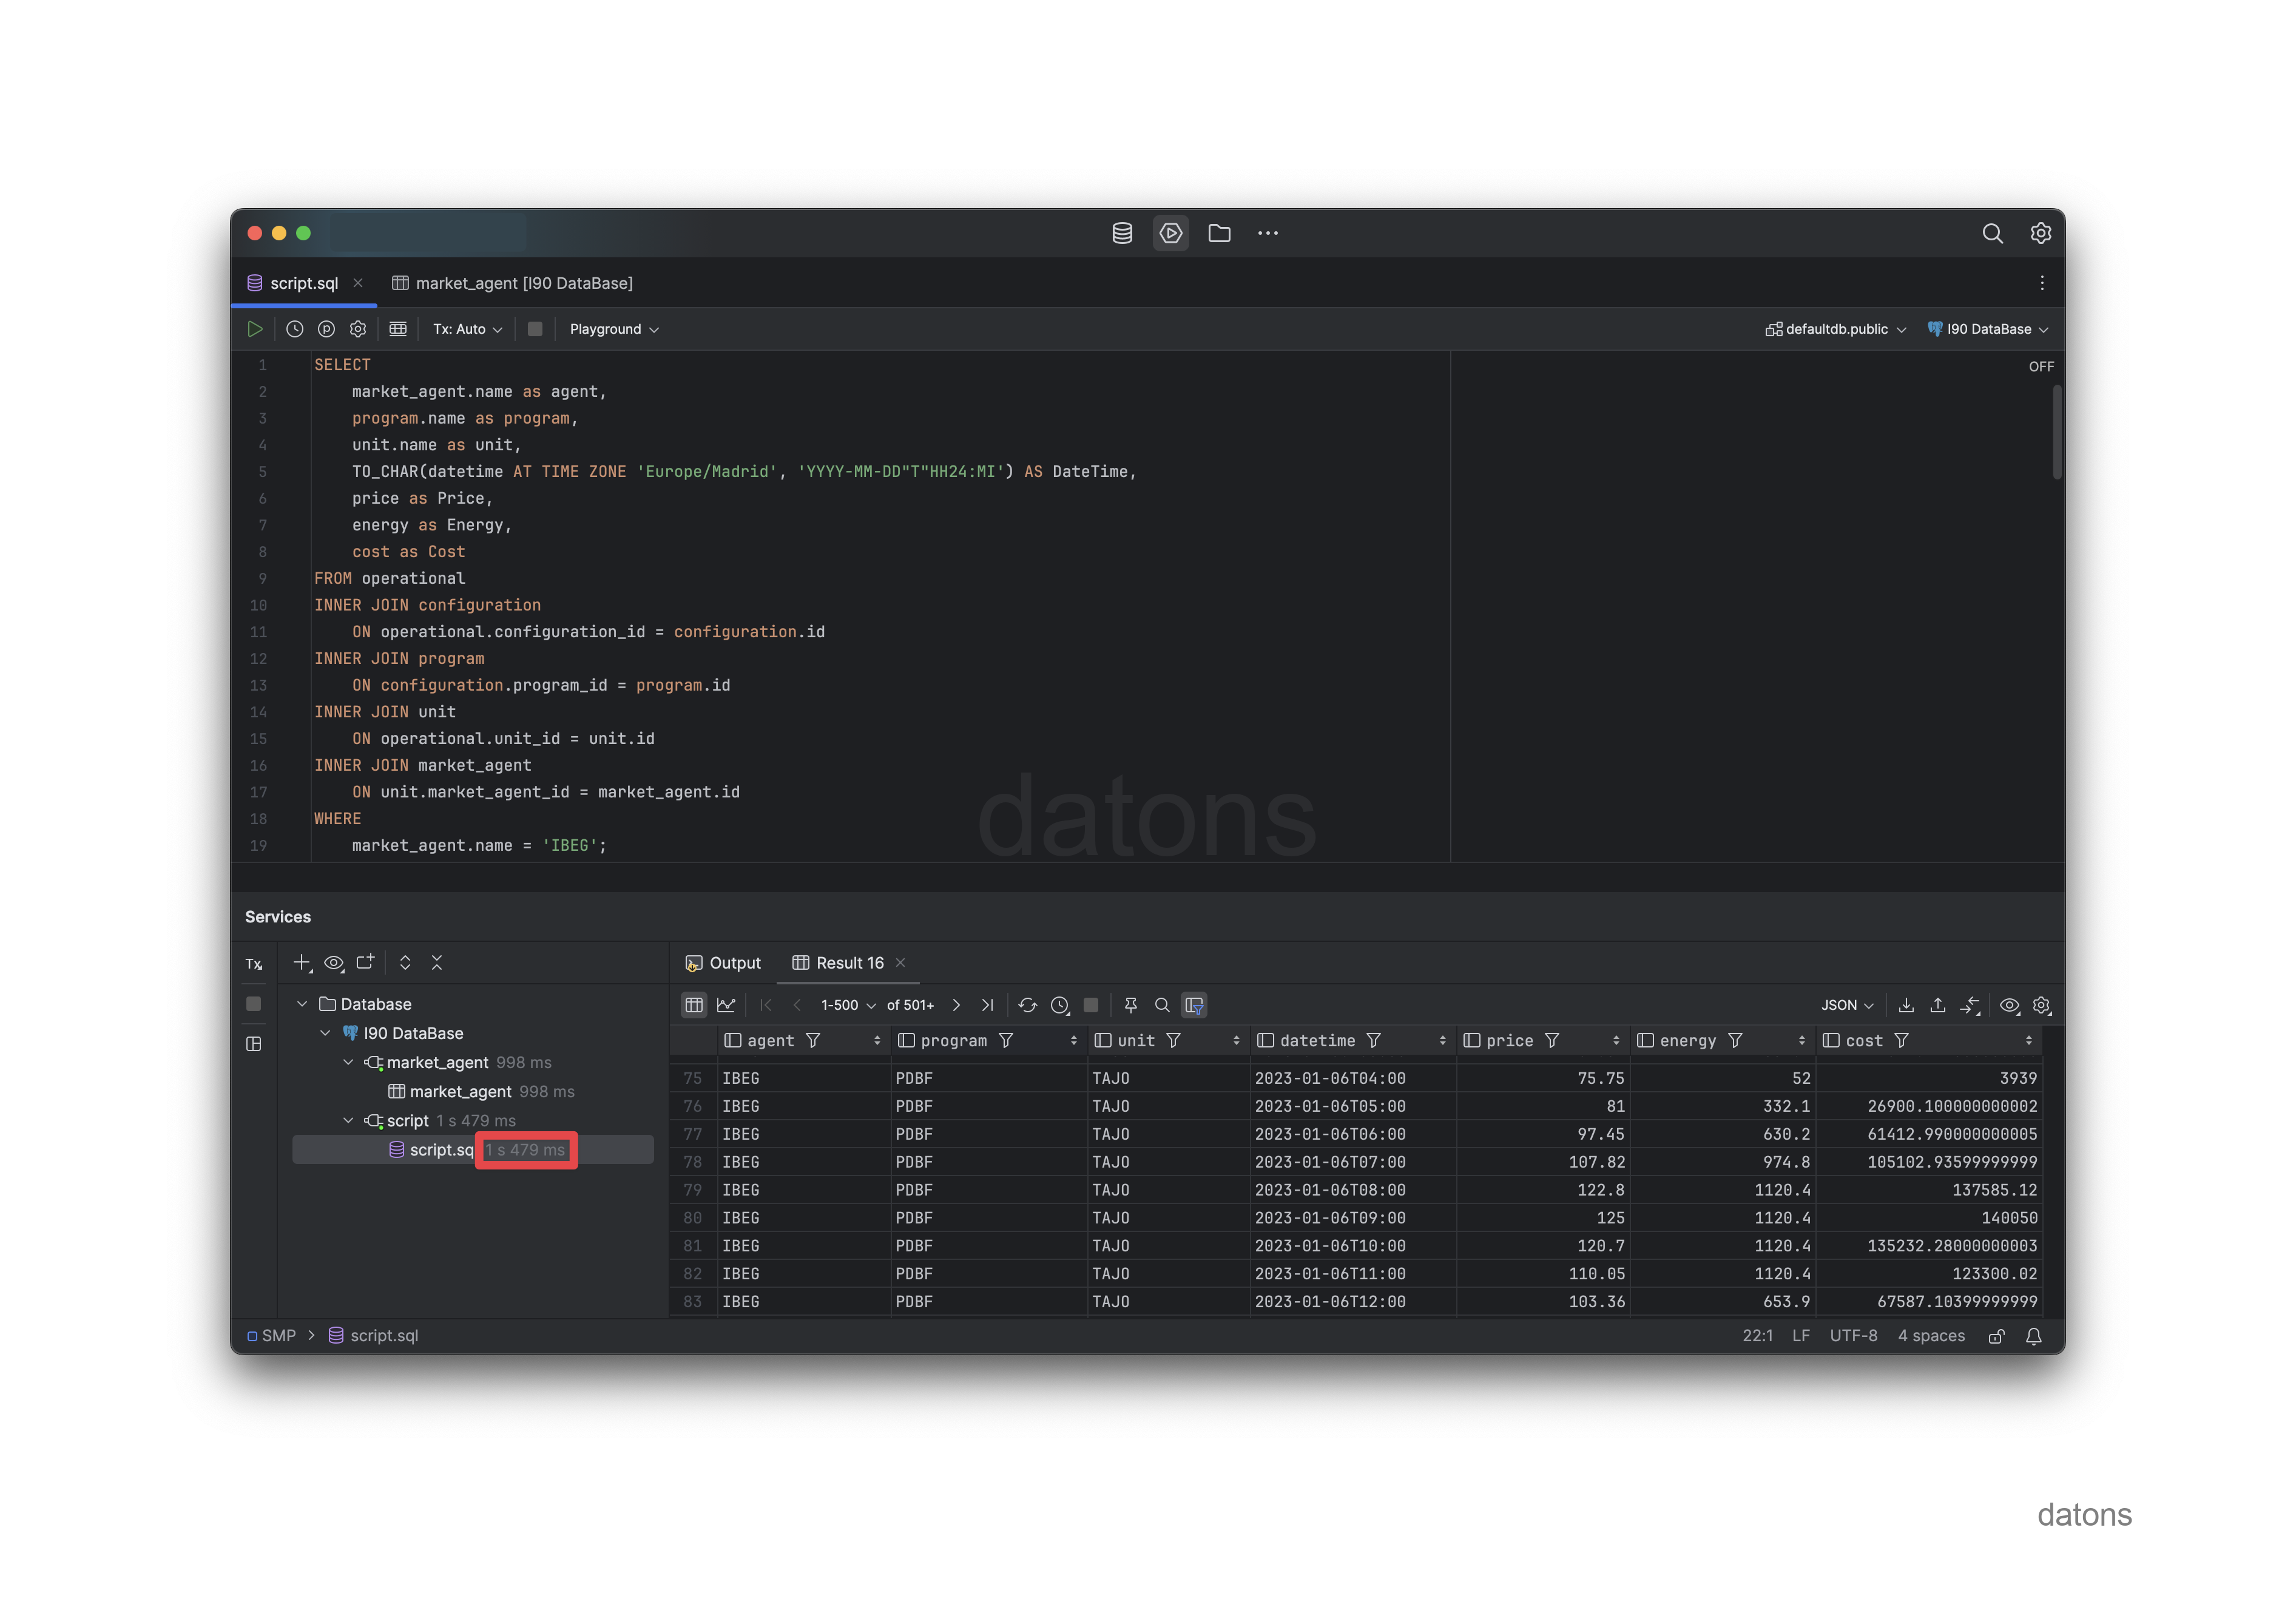
On the other hand, if we develop a database to store the information in a structured way in a single table where we categorize the data by market subjects, programming units, generation programs, and result type, we could query the information much more efficiently.
For example, if we request all the operational information of the Iberdrola units with code IBEG, it would take less than two seconds.
We spend more time preprocessing the Excels for each new analysis than developing the database and dumping the most updated information every day.
Process to develop DB system
Normalize data structure
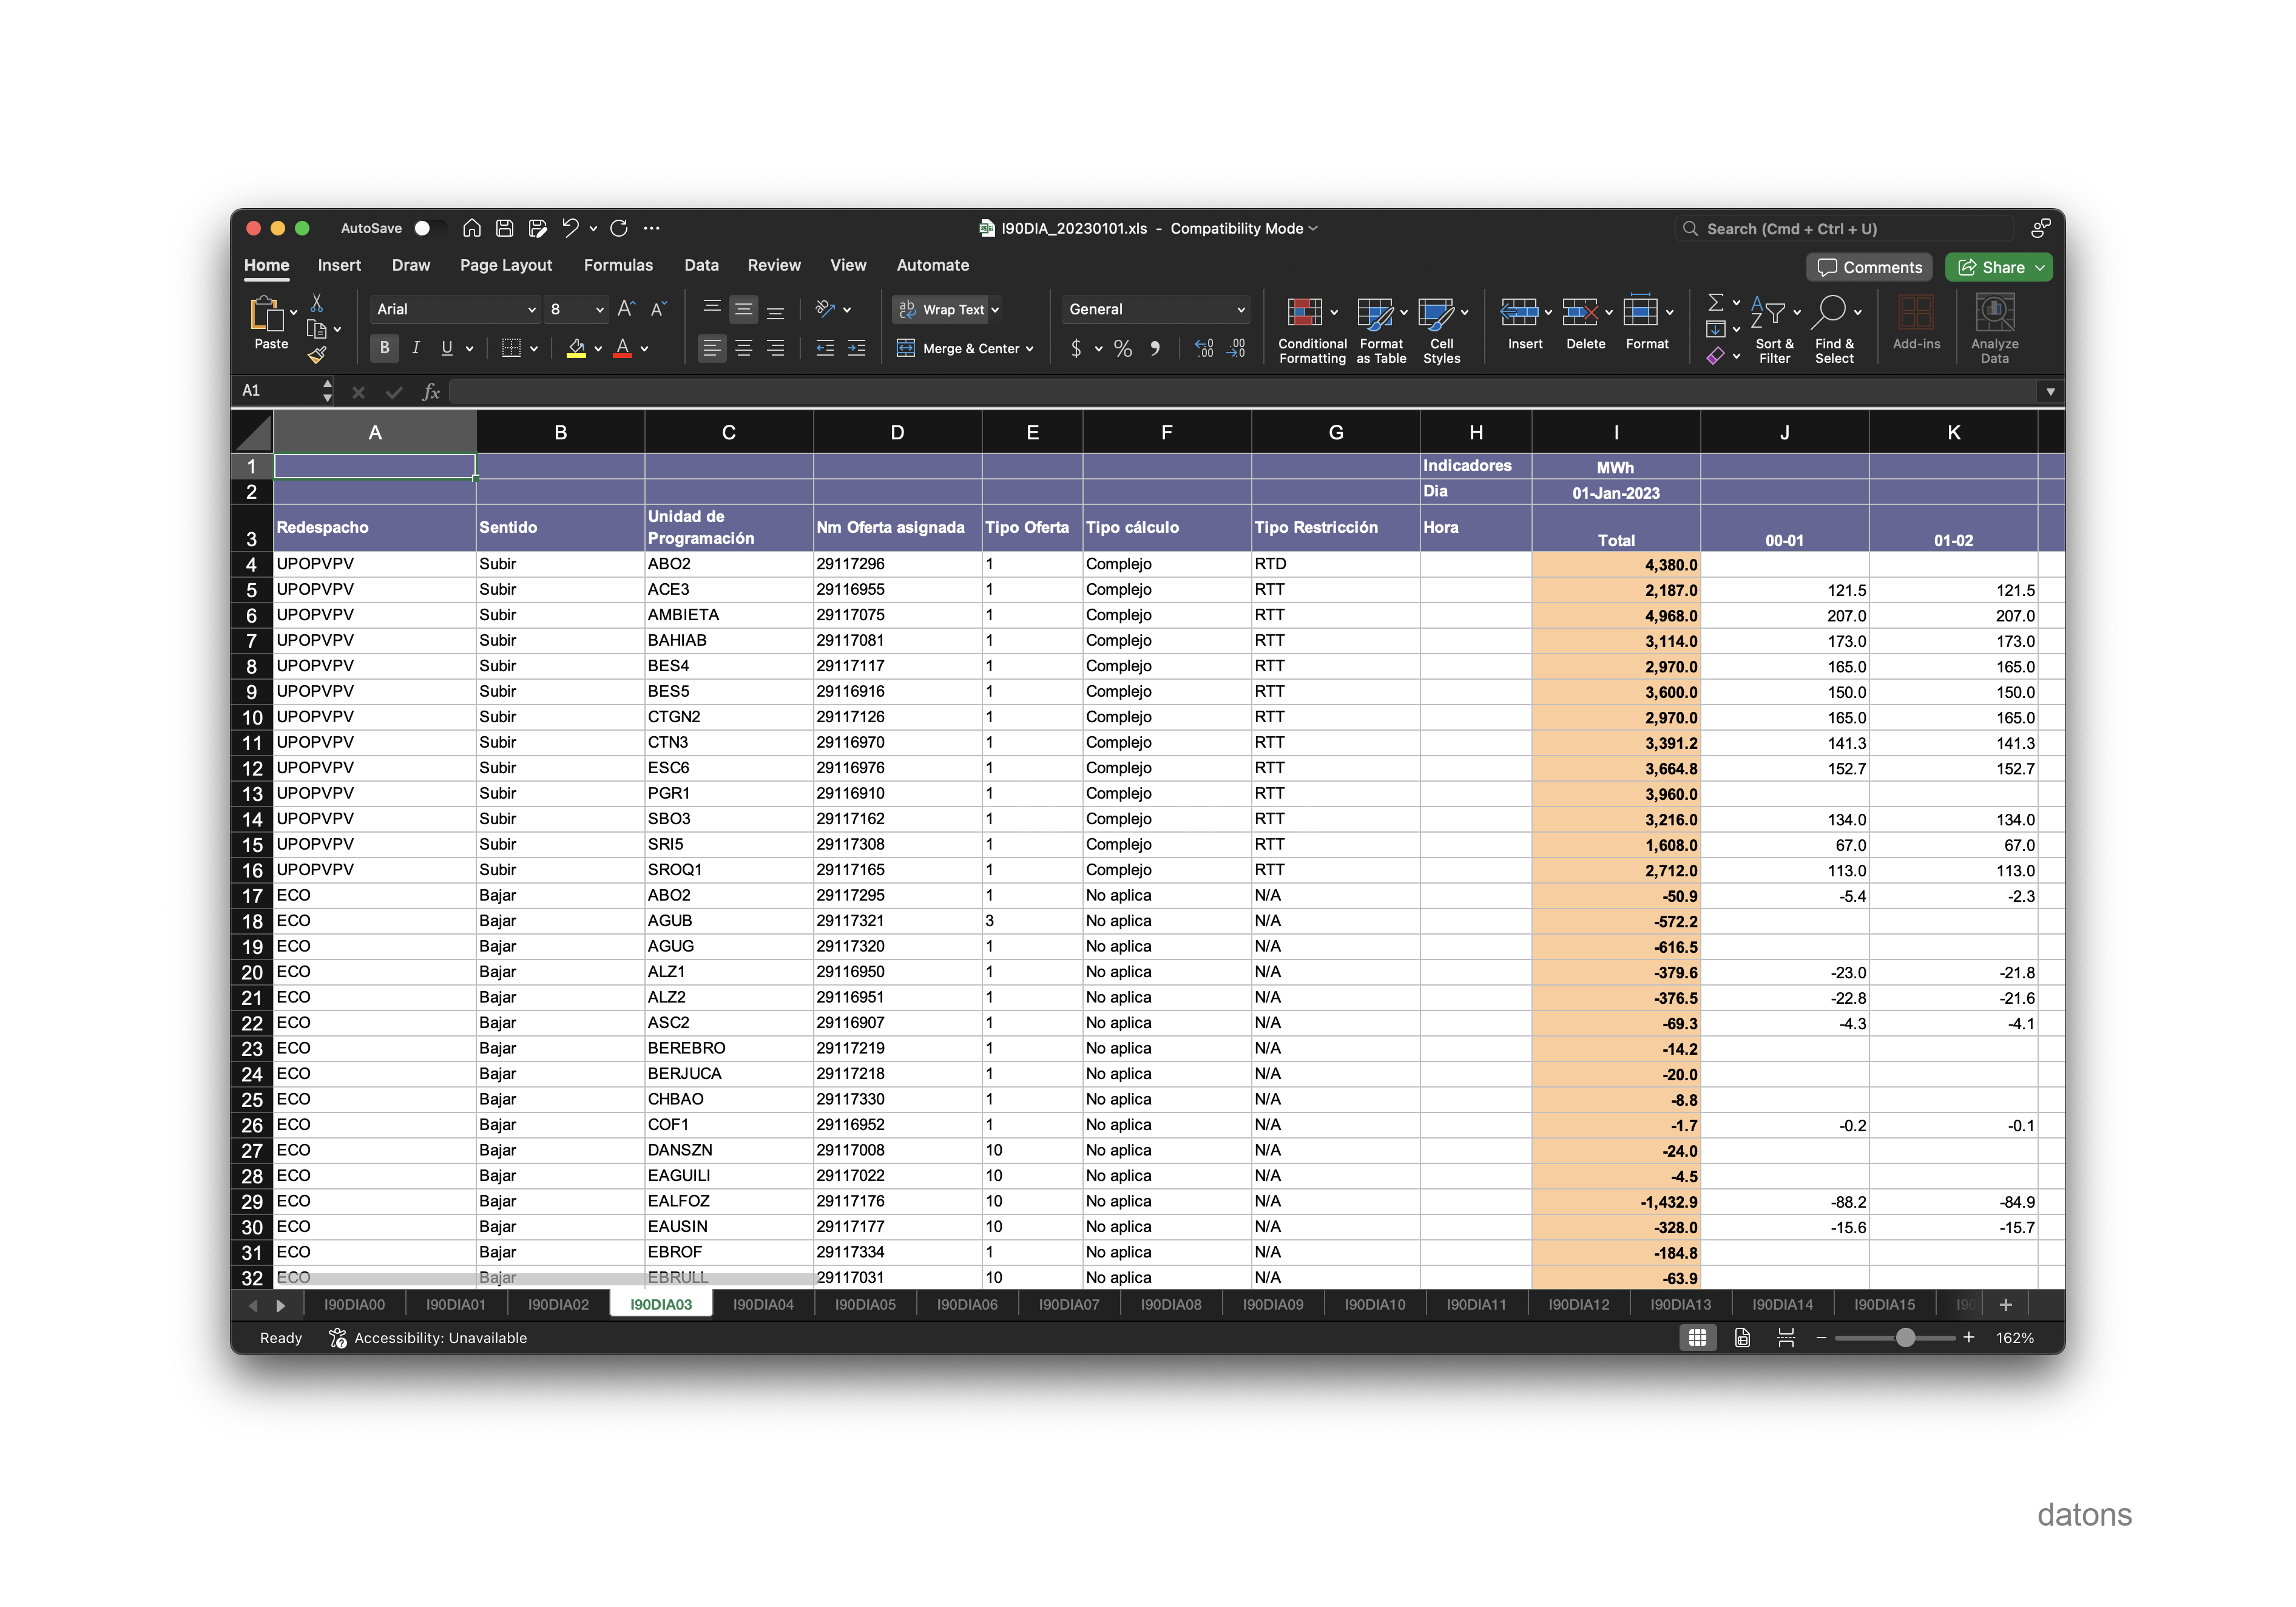
There are many Excels, each with similar but not identical columns. Additionally, the values are sometimes in MWh and others in €/MWh. The I90 data from REE are from generation units, each sheet representing a different program and result type.
The Excel information is not normalized. That is, the records are not in a single table differentiated by columns that classify the observations. Instead, the records are in different sheets according to the program and result type. For example, the I90DIA03 sheet only contains the result of the resolution of restrictions in the day-ahead market, in MWh.
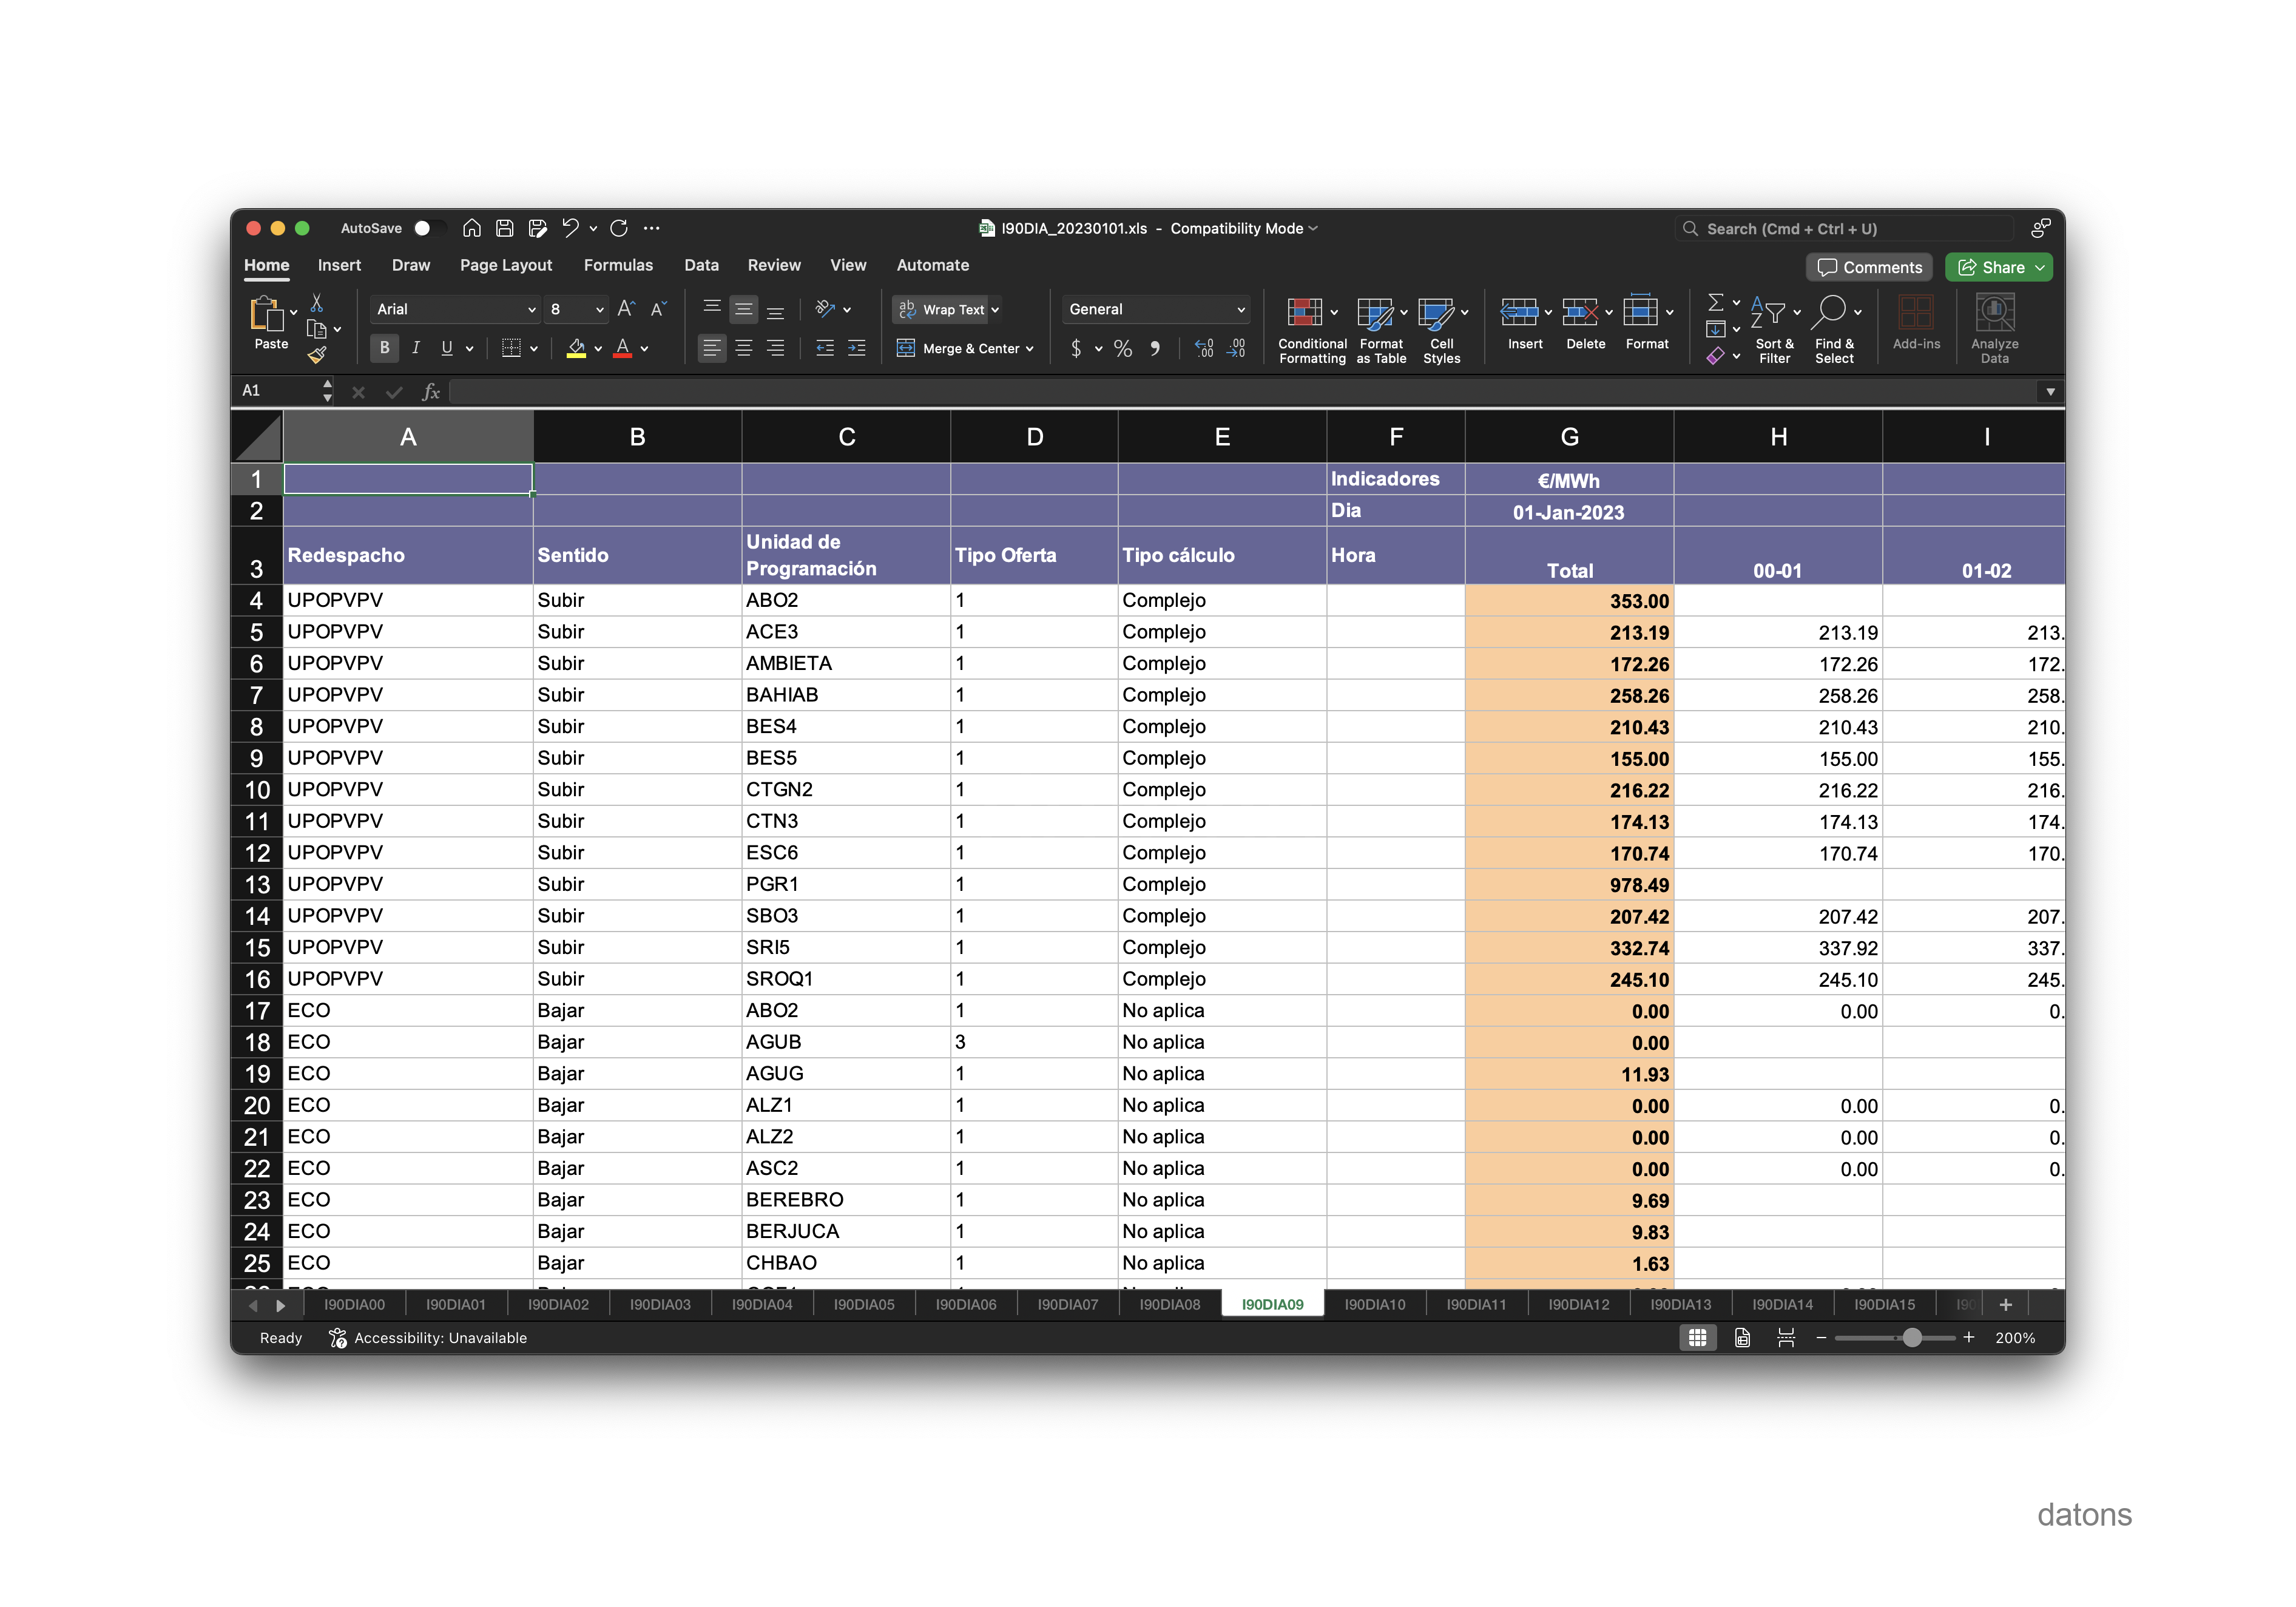
If we wanted to look at the price, in €/MWh, that the units would charge for these restrictions, we would have to go to the I90DIA09 sheet.
Using the domain knowledge provided by the Official State Gazette on the operation of the electrical system in Spain, we can transform all the Excel sheets into a single table that contains the information classified as follows:
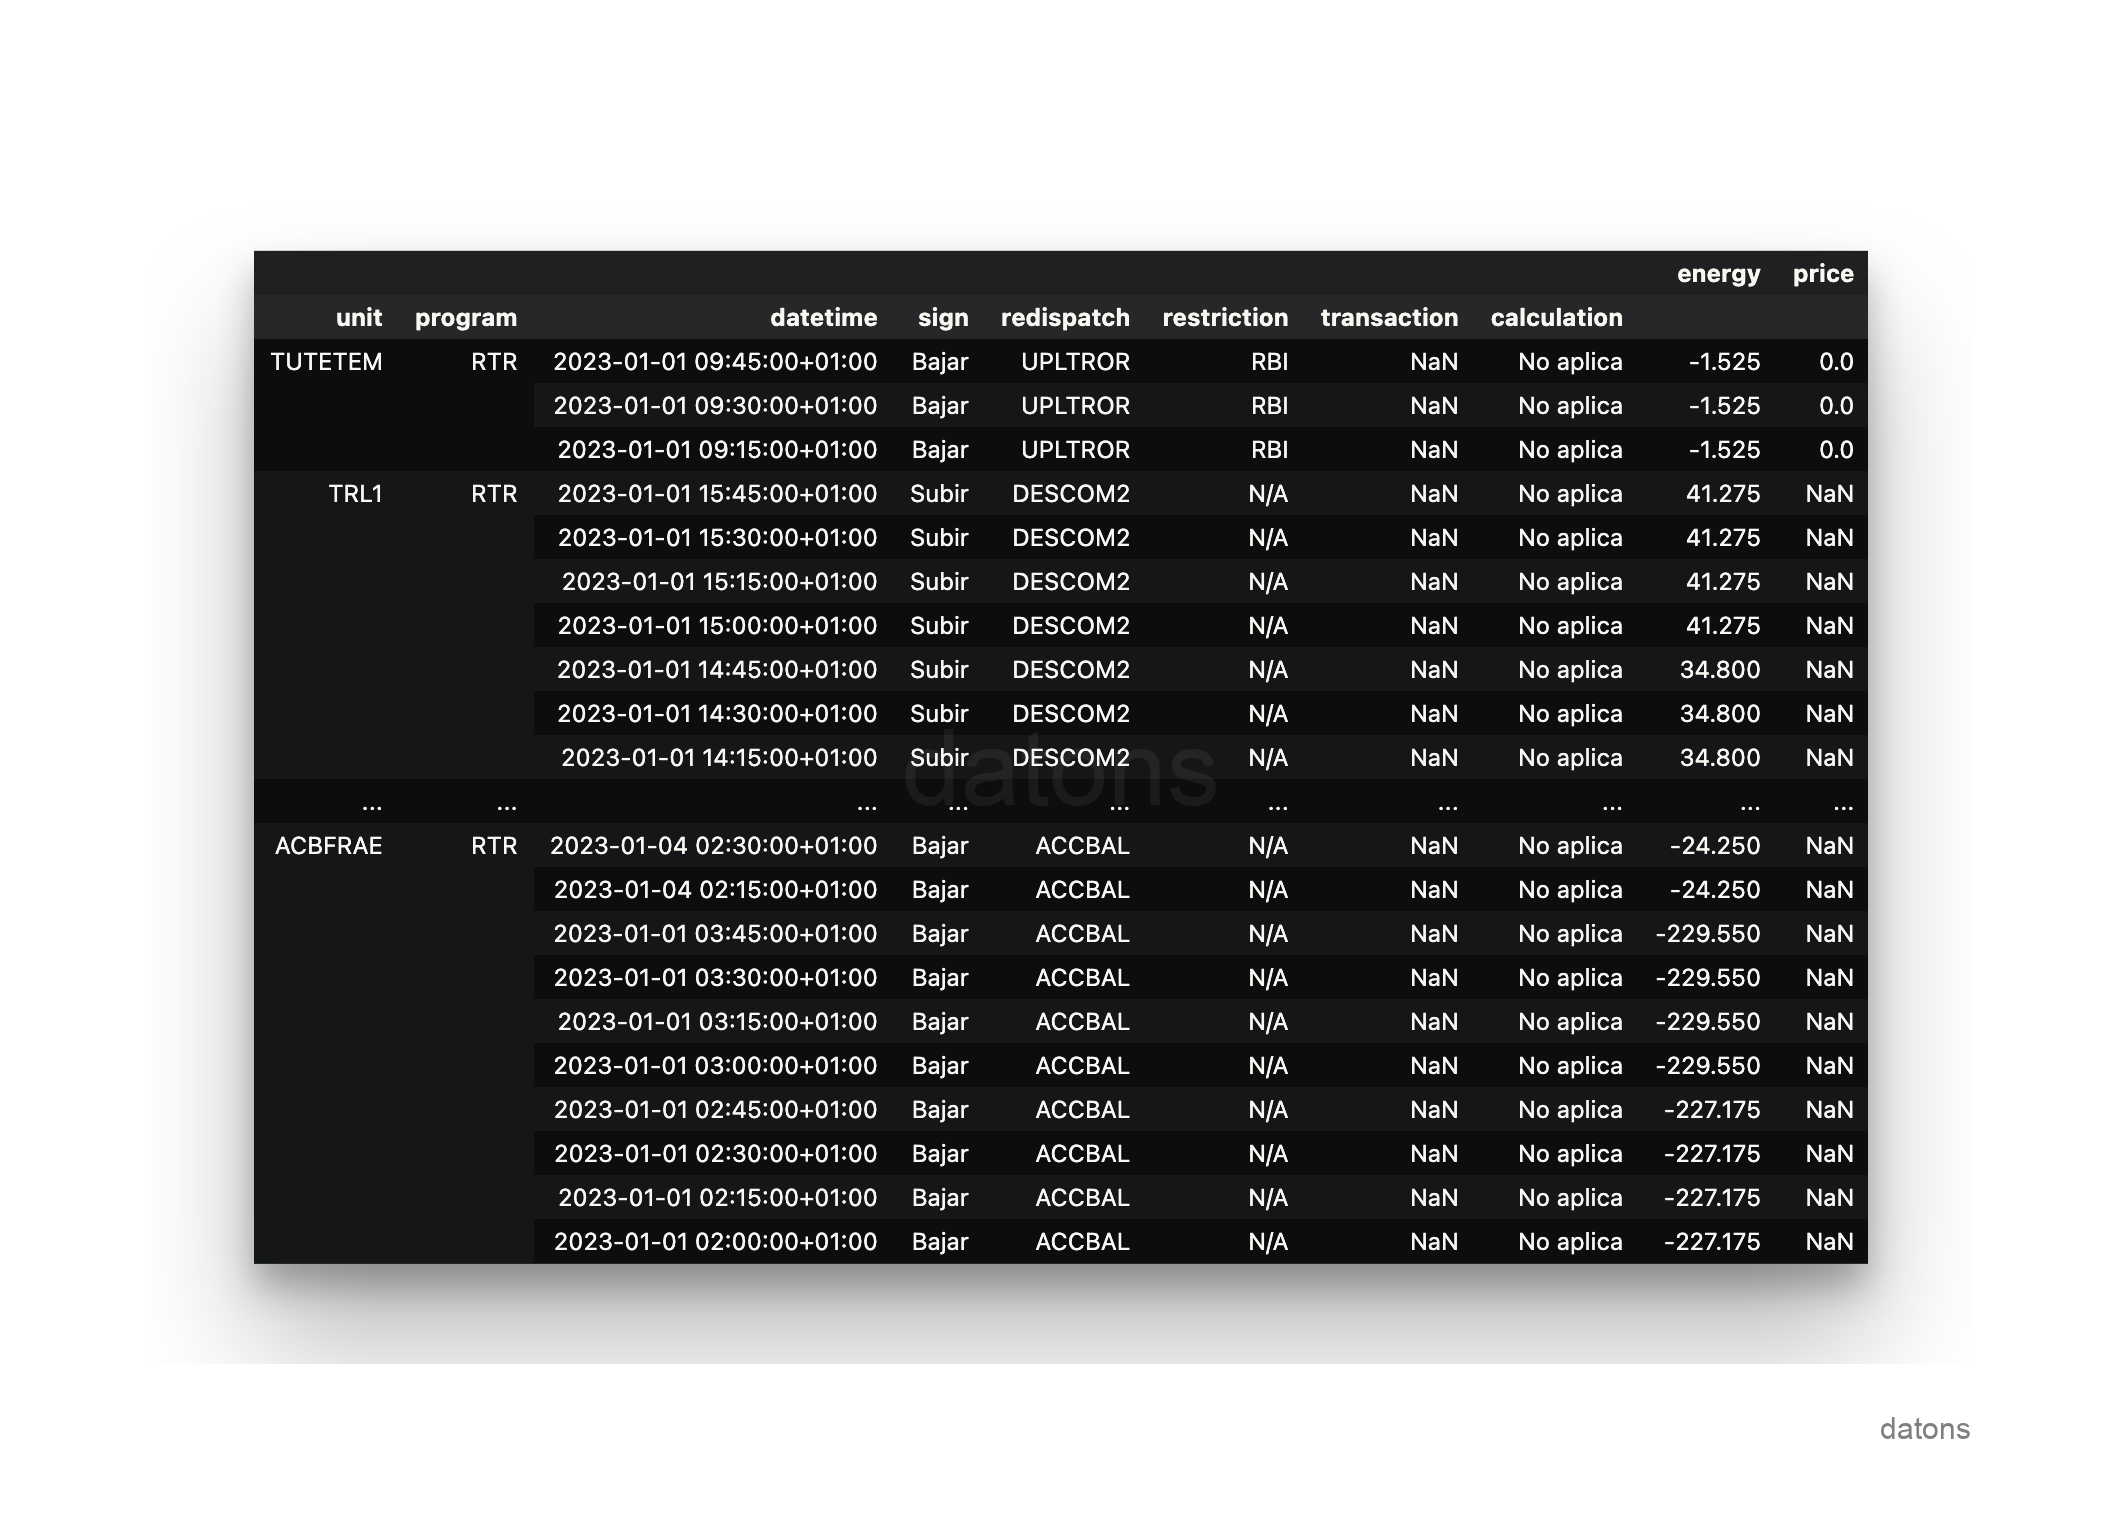
Each record represents a programming unit in a generation program, which has been adjusted in a certain way by the market and system operators, OMIE and REE, respectively, to generate, or not, a certain amount of energy at a specific price.
Design DB schema
Once the relationships between the tables are structured, we can define the DB schema following the relational model and applying techniques such as normalization to avoid information repetition. For example, programming units have an associated technology, which can be hydraulic, wind, solar, etc.
To avoid duplicating the technology type information in the operational data table, we create a specific table for the programming units. This table will contain the information of each programming unit and its associated technology, separate from the operational data table.
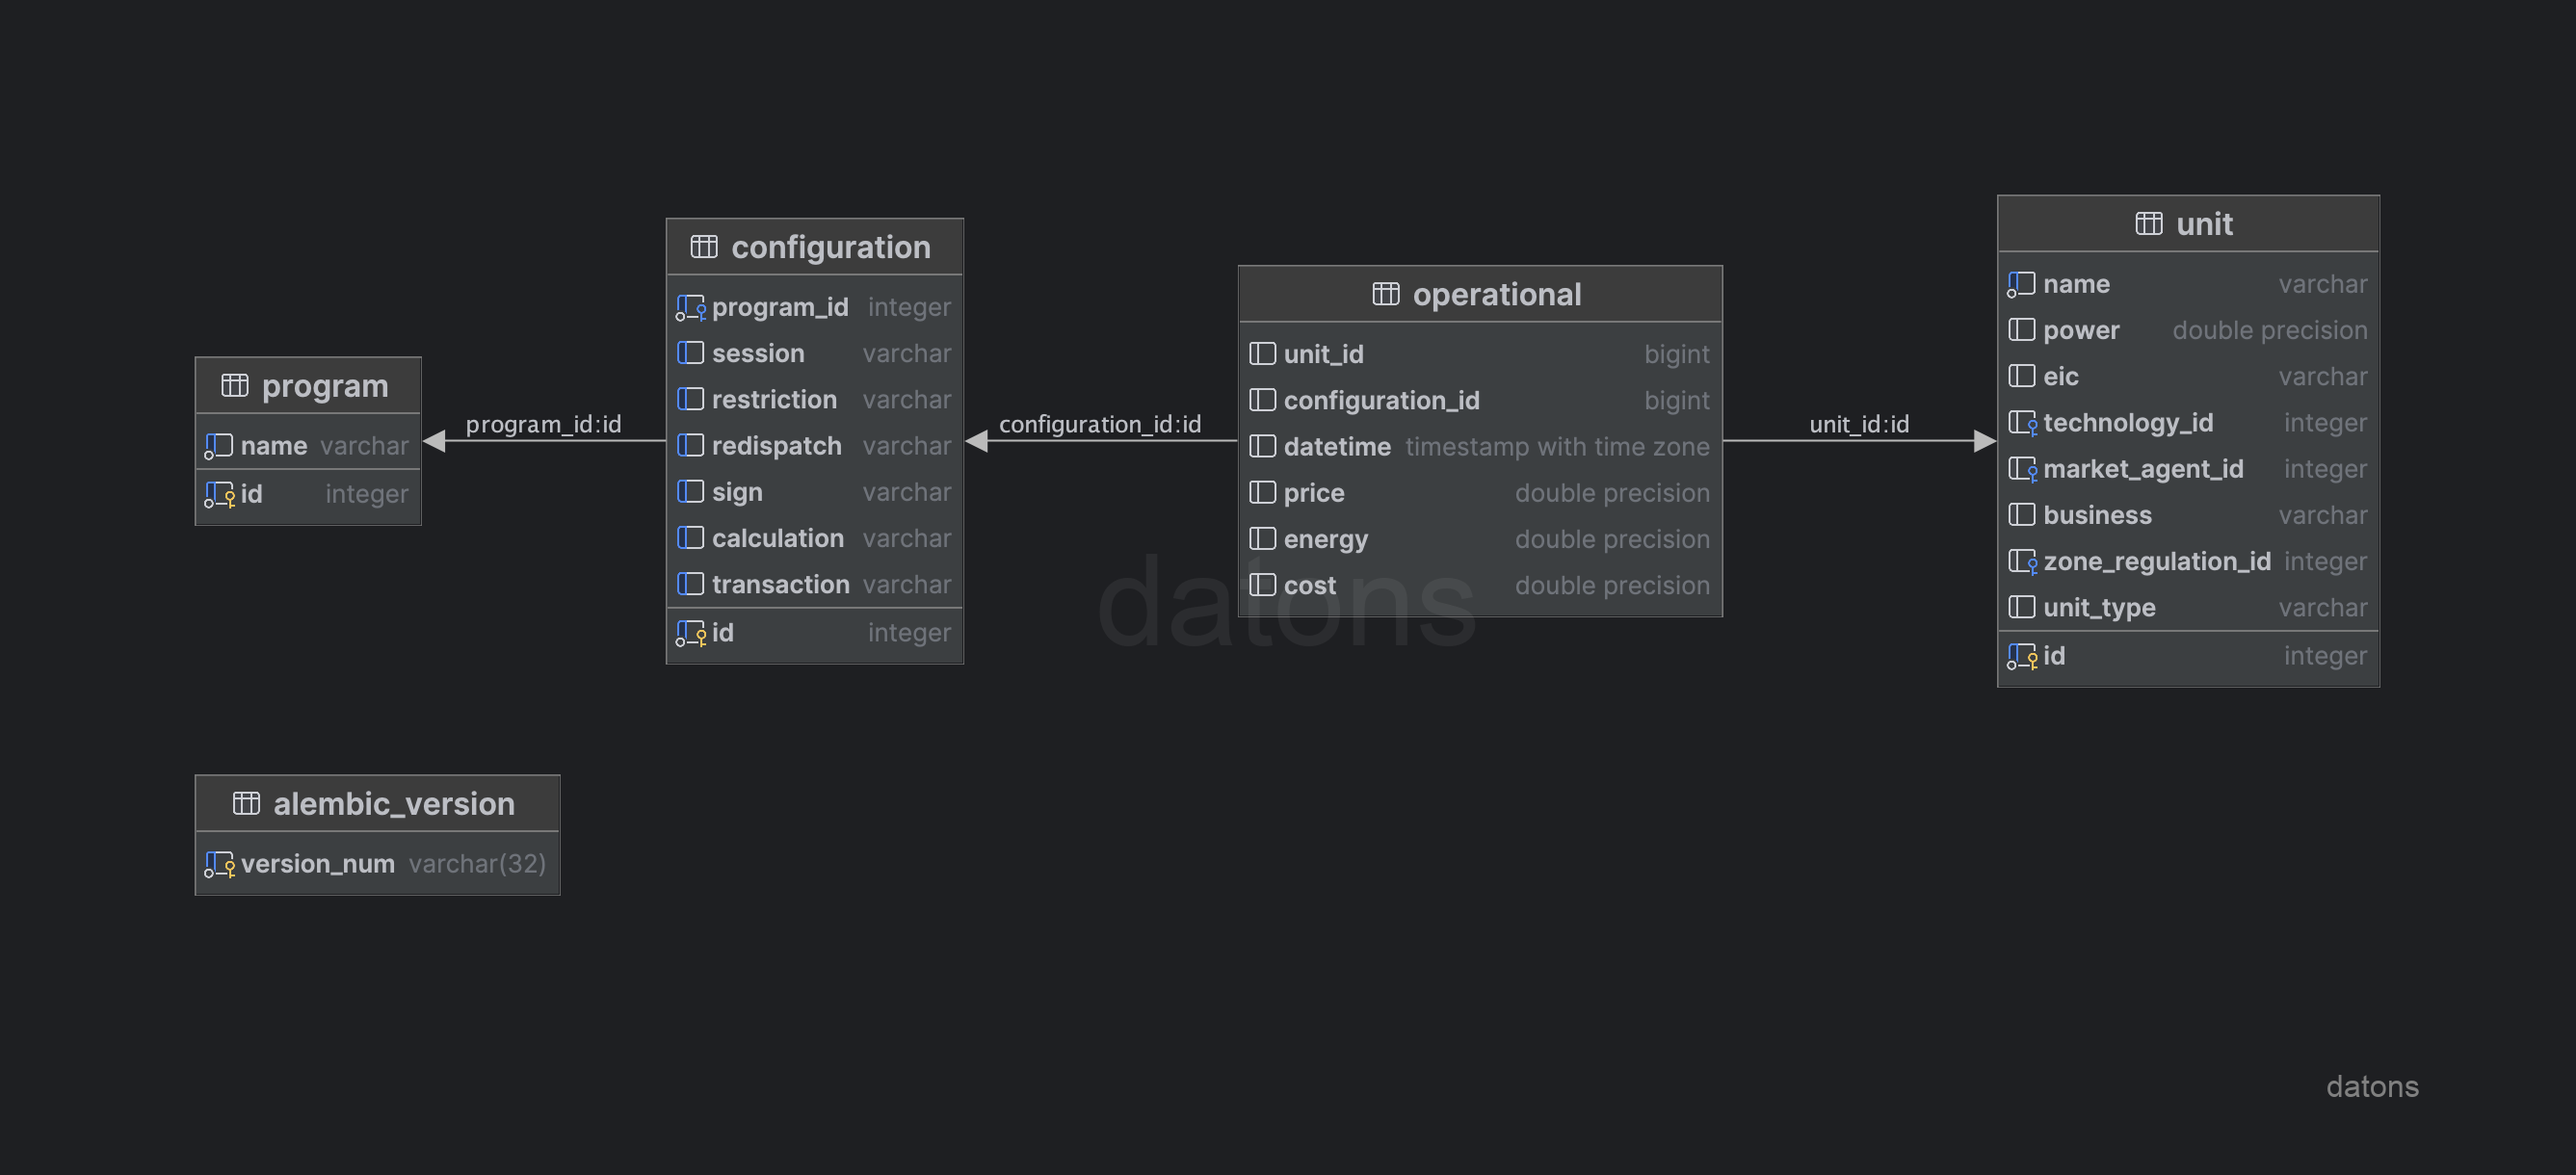
unit: information of the programming units, such as the technology they use to generate energy.configuration: configuration of the generation programs, such as the type of restriction applied.program: information of the generation programs.operational: operational information of the programming units (energy and price according to program, unit, and operational conditions).
Rent DB
Once the DB schema is designed, we can rent a cloud DB to connect to it from any client (Python, Excel, Power BI, etc.)
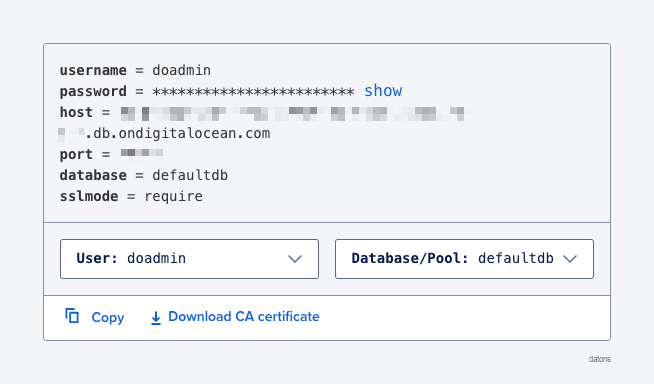
In our case, we have rented a PostgreSQL DB for $15 a month on Digital Ocean. Initially, it is not advisable to over-rent resources (memory, CPU, etc.) to avoid spending money on things we do not need. If we need more resources, we can scale the DB in question with a click.
Once the DB is created, they provide us with the credentials that we will use later to connect to it.
Create tables in DB
To create the tables in the DB, we must first define the schema of the tables in a file. In our case, we have defined the schema in a models.py file that contains the structure of the tables, with columns and data types.
Now we create the connection to the DB with the credentials provided by Digital Ocean.
from sqlalchemy import create_engine
engine = create_engine(f'postgresql://{USER}:{PASSWORD}@{URL}:{PORT}/{DATABASENAME}')
Finally, we create the tables from Python.
from models import Base
Base.metadata.create_all(engine)
All good so far, but the tables are empty. How do we insert the data? How do we query it?
Interact with DB
Insert records in DB
By structuring the information in different tables to avoid repeating information, we must segment the normalized Excel into different files to insert them into the corresponding tables of the DB.
Therefore, we segment the normalized Excel into different tables and export them to new Excel files.
segment_table(entity='unit').to_excel('unit.xlsx')
segment_table(entity='program').to_excel('program.xlsx')
...
segment_table(entity='operational').to_excel('operational.xlsx')
Again, with Python, we can insert the data into the DB directly from the Excel files, using the pandas library.
import pandas as pd

df = pd.read_excel('unit.xlsx')
df.to_sql('unit', engine)

df = pd.read_excel('program.xlsx')
df.to_sql('program', engine)

...

df = pd.read_excel('operational.xlsx')
df.to_sql('operational', engine)
It was not necessary to export the data to Excel because we already had it in Python. However, it is good practice to separate processes to avoid, in the future, mixing data if we use the same code.
Request data from DB
We can now request data from the DB. For example, let’s see the data of some programming units of Iberdrola that contain IBEG in their name.
SELECT *
FROM unit
WHERE name LIKE '%IBEG%'
At the moment, the database is very poor because it has just enough information to relate the operational data of the programming units with the generation programs. If we want to add information according to the type of technology, we must extend the DB schema.
Extend DB schema
The information of the programming units, such as the technology or the market subject that manages it, is on the REE website.
To insert this information into the database, we first extend the schema of the units table with the new columns in models.py and update the DB.
Base.metadata.create_all(engine)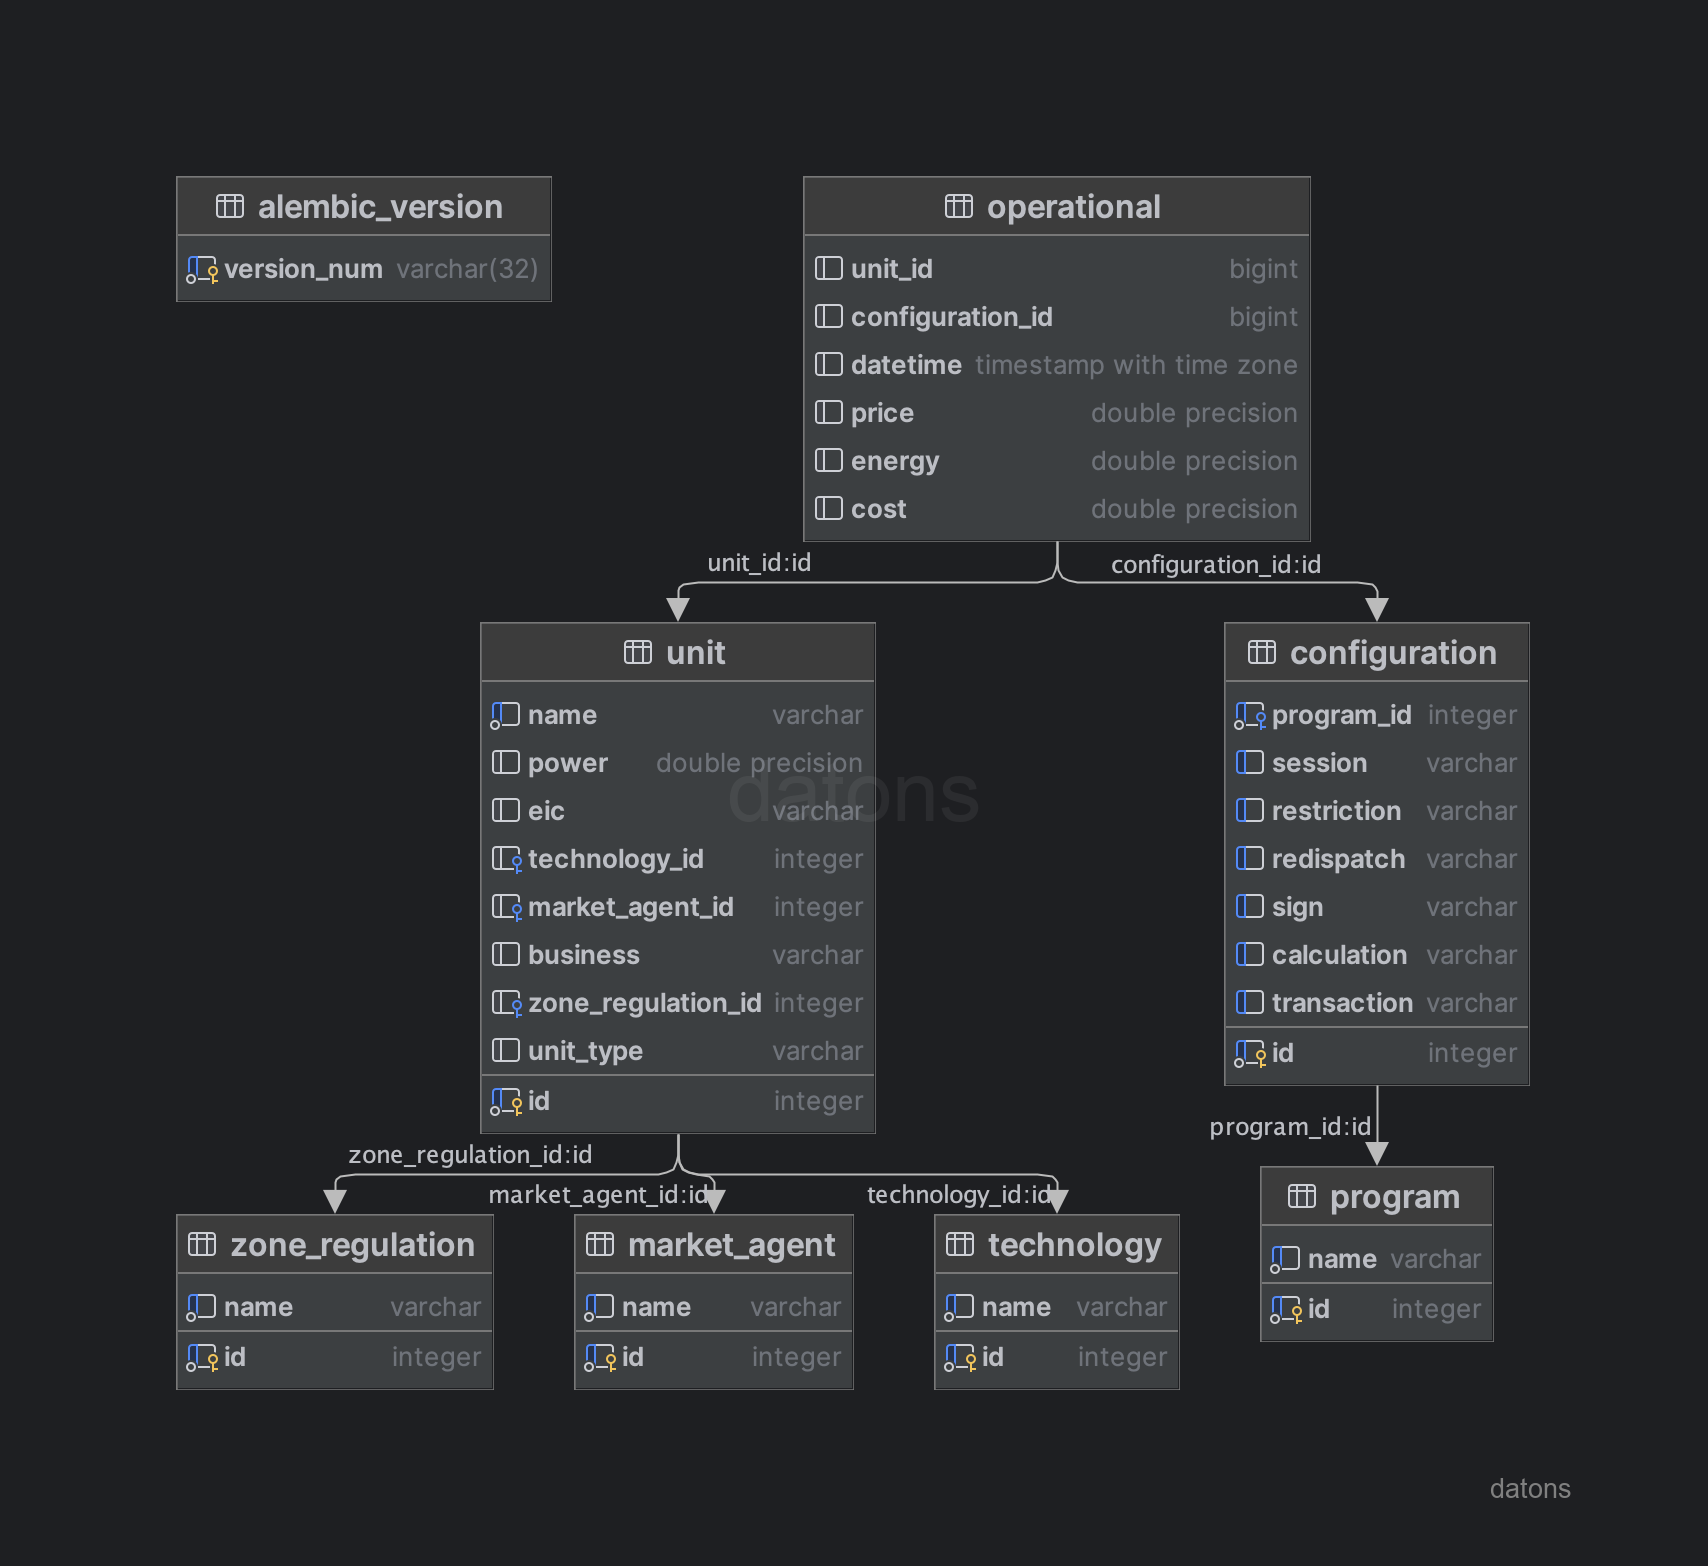
We download the data from the REE website, preprocess it according to the DB schema, and insert it into the same.
df = pd.read_excel('units_ree_I90.xlsx')
df.to_sql('unit', engine, if_exists='replace')
Now, we will not only have more information about the programming units, but we will also be able to request the information of the programming units according to the market subject. For example, let’s see which programming units are managed by the market subject IBEG, belonging to Iberdrola.
SELECT *
FROM unit
INNER JOIN market_agent
   ON unit.market_agent = market_agent.id
WHERE market_agent.name = 'IBEG'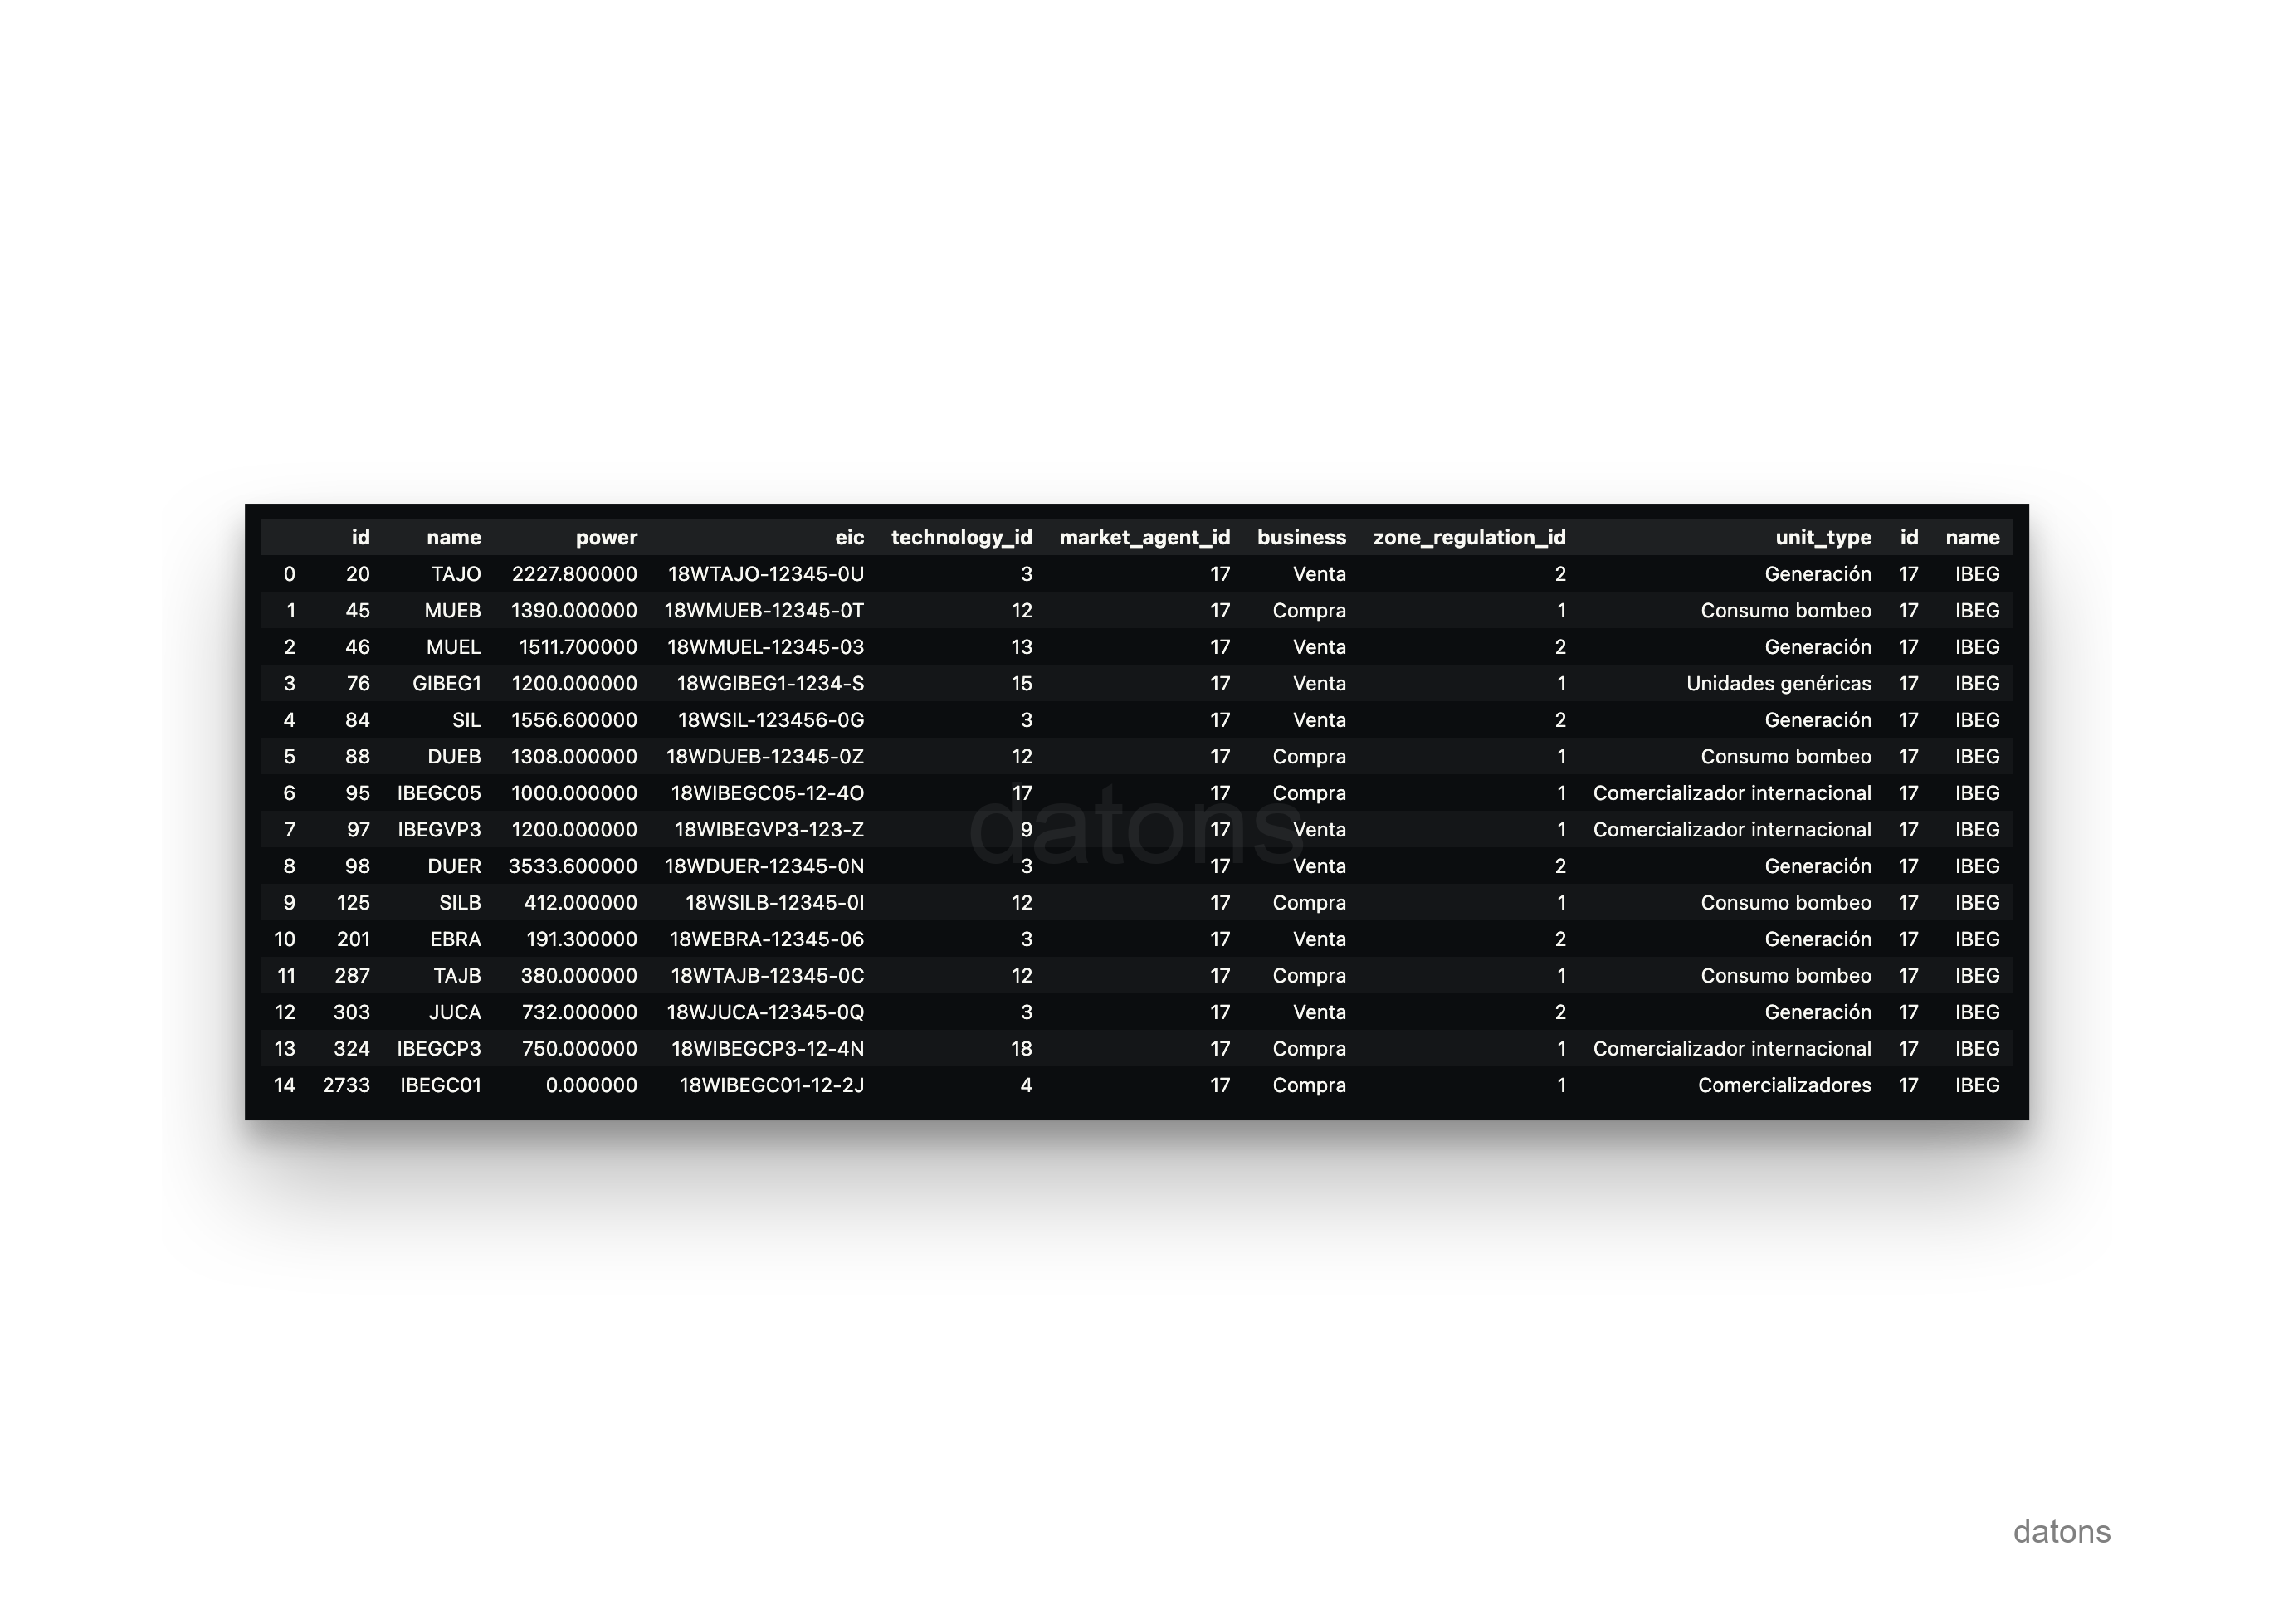
We can also use the market subject to request the operational information of the programming units.
SELECT
    unit.name AS unit_name,
    program.name AS program_name,
    operational.*,
    configuration.*
FROM operational
INNER JOIN unit
    ON operational.unit_id = unit.id
INNER JOIN market_agent
    ON unit.market_agent_id = market_agent.id
INNER JOIN configuration
    ON operational.configuration_id = configuration.id
INNER JOIN program
    ON configuration.program_id = program.id
WHERE market_agent.name = 'IBEG'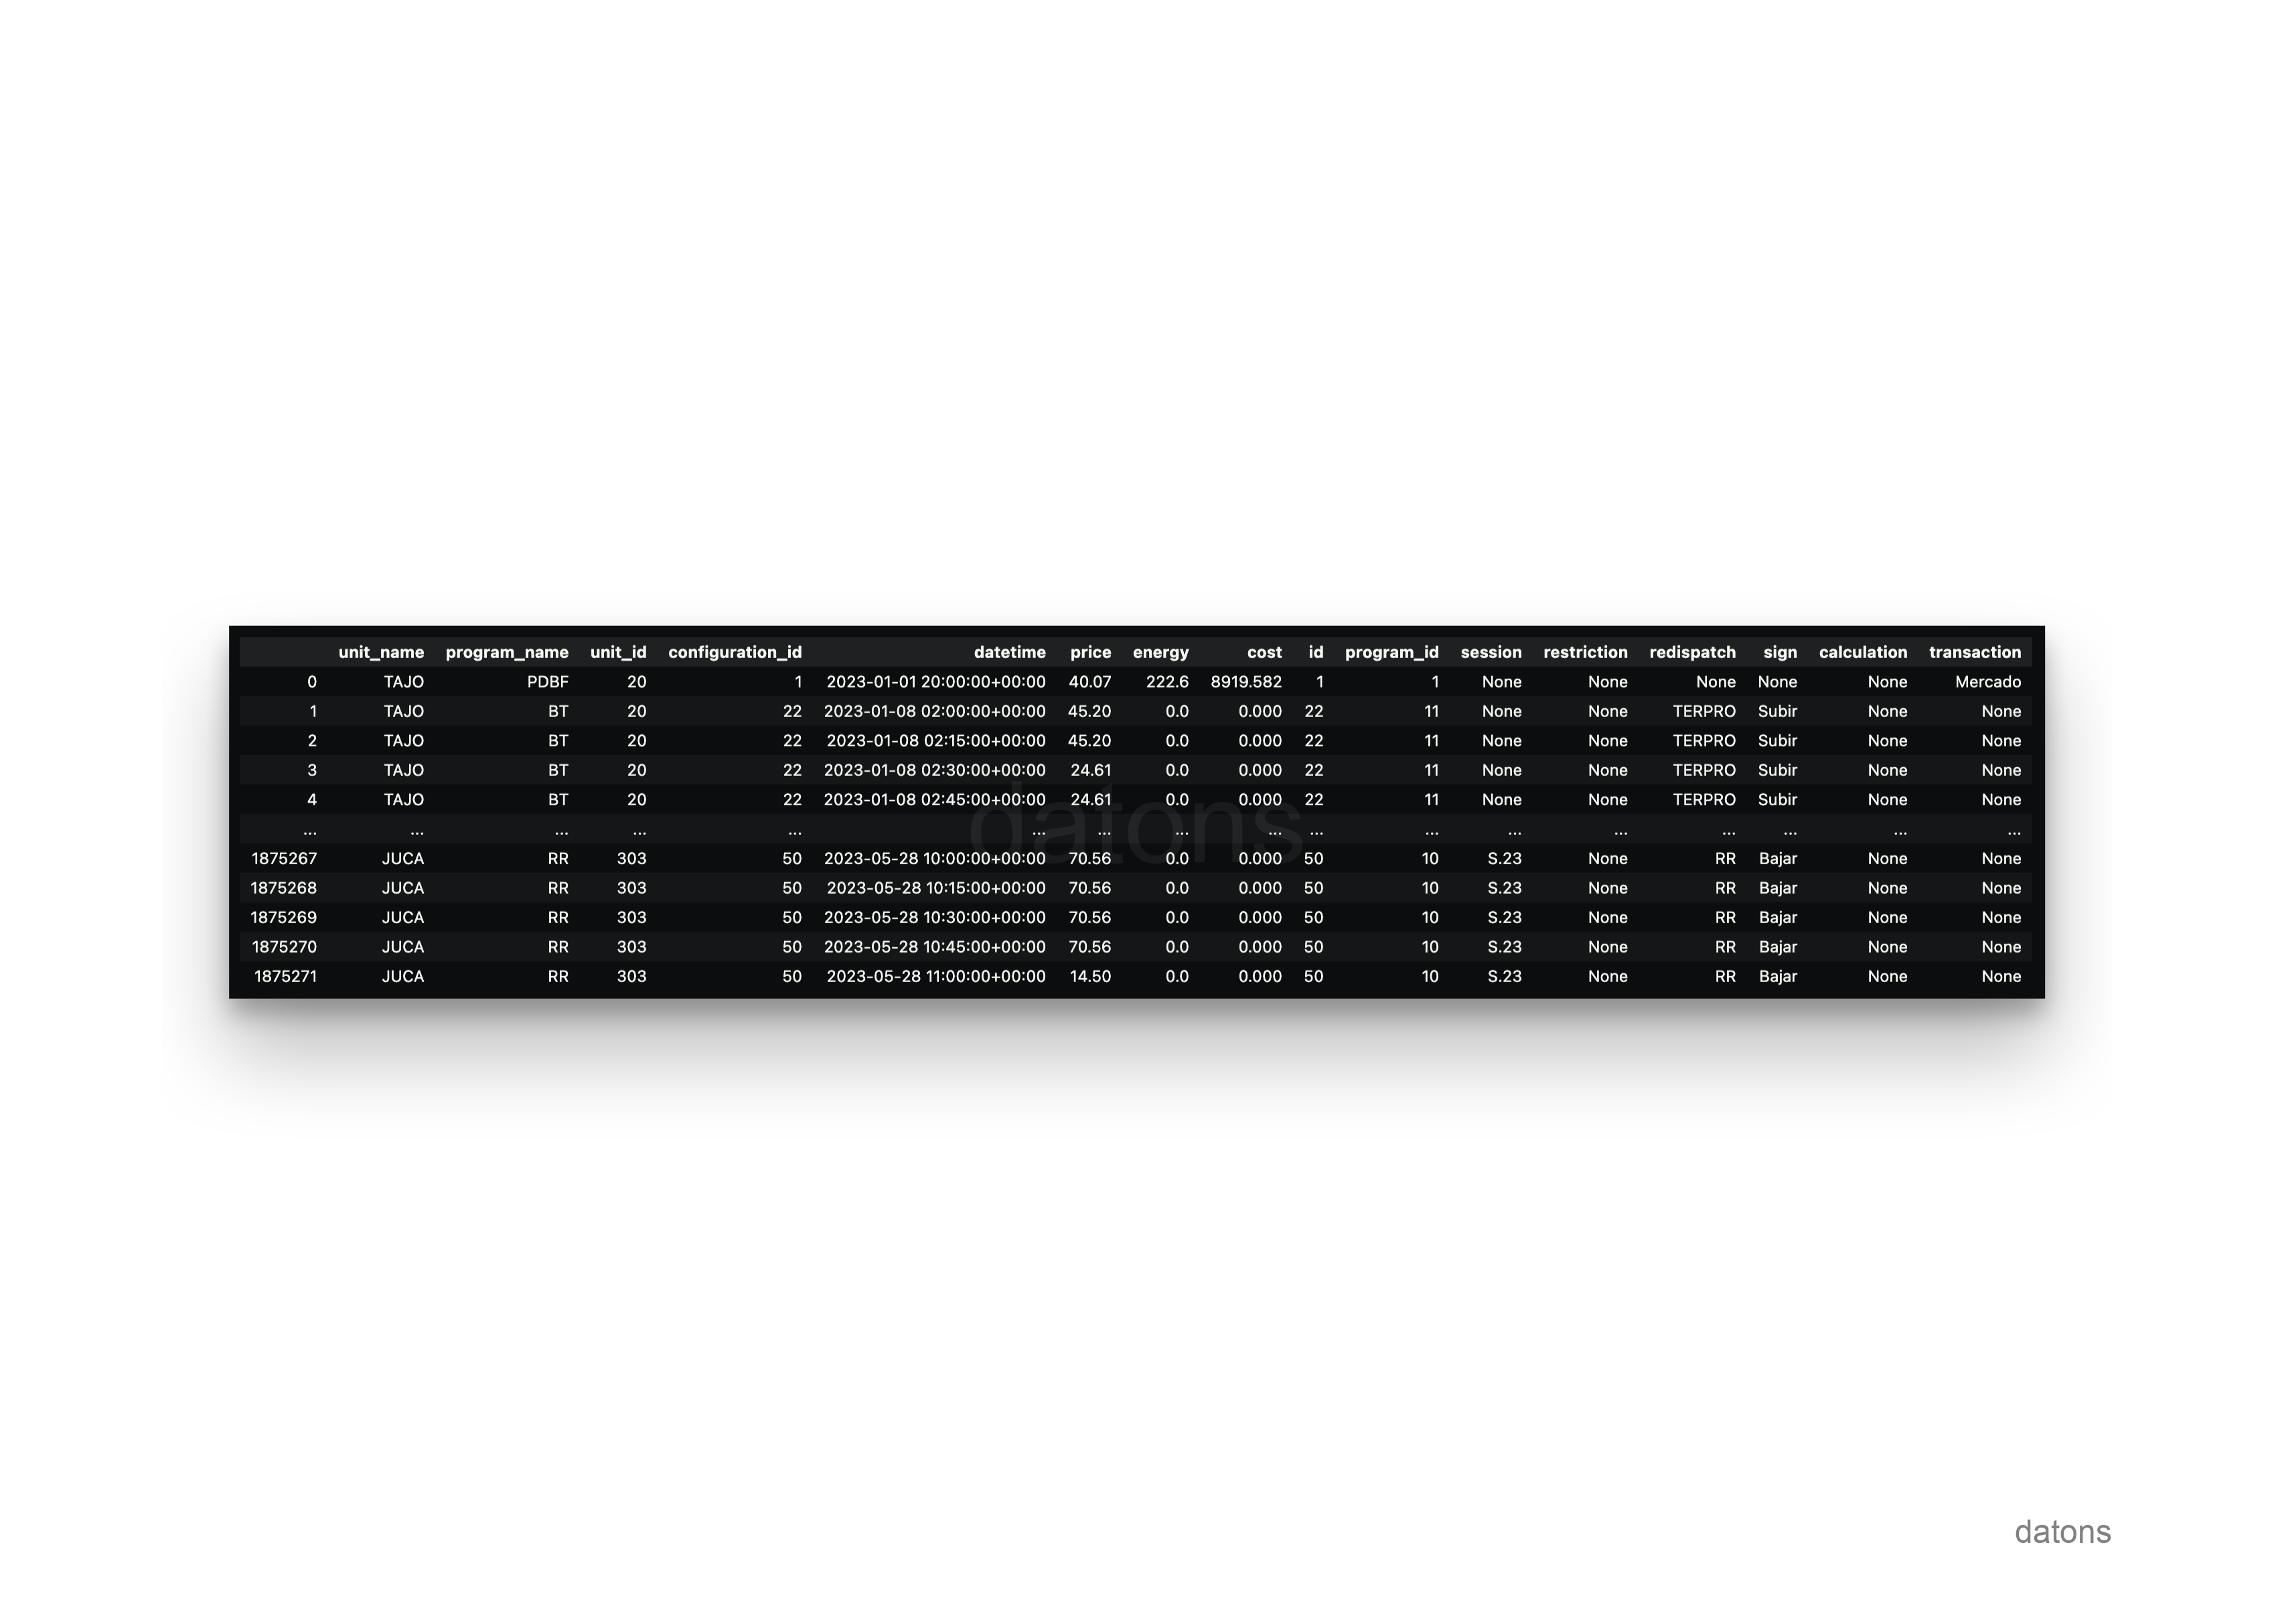
Share DB access
If you work in a team, you will need to share the information with them. How can you give them access to the information?
Credentials
By passing them the DB credentials and indicating how to access through an SQL client, like Python.
from sqlalchemy import create_engine
engine = create_engine(f'postgresql://{USER}:{PASSWORD}@{URL}:{PORT}/{DATABASENAME}')
Query DB with Pandas in Python
As well as querying the DB with the pandas library: you define the query and execute it with the pd.read_sql function, connecting to the DB with engine.
query = """
SELECT
   *
FROM
   unit
WHERE
   market_agent = 'IBEG'
"""

pd.read_sql(query, engine)
What if my colleagues do not handle Python?
Other programs to query DB
The DB is hosted on a URL that anyone with the credentials can access. Therefore, there are many programs that, given the credentials, can connect to the DB and execute queries. Here are some examples.
Improvements
Like any company, not everyone can access the database. Therefore, we need to protect the information and ensure that only authorized users can access it. Here are some of the improvements we can apply.
- User and permission management
- Restricted connection through VPN
- Continuous execution to update the DB
- API to query data without needing to know SQL
- Migration management when modifying DB schema
- Schema optimization for faster queries
- Manipulate DataFrame with faster libraries
With programming, anything is possible. You just need a technology partner to help you develop your custom system.
Conclusions
- Centralized and Updated Access: All historical information from REE is in one place, eliminating the need to send Excels by email that get lost or become outdated.
- Speed and Efficiency: Queries are performed in seconds, even for large volumes of data, without relying on manual processes.
- Integration with Advanced Tools: Compatible with Python, Power BI, Tableau, and other tools, allowing analysis, visualization, machine learning, and artificial intelligence.
- Centralized Collaboration: Facilitates teamwork by ensuring uniform and secure access to information, without duplication or unsynchronized version issues.
- Automation and Error Reduction: Automates repetitive tasks like cleaning, normalization, and data insertion, optimizing time and minimizing human errors.
- Scalability and Flexibility: The system grows with business needs, allowing resources to be expanded without interruptions or limitiations.
- Preparation for Advanced Analysis: Offers an ideal structure to implement predictive techniques and advanced algorithms, aiding in strategic decision-making.